
Infoactive. Teaching data visualization: Recommended readings, resources. I want to share the reading/resource list in my data visualization course; the list breaks into six sections: intro to data viz, choosing the right chart, designing a nice-looking visulization, communicating your message, tools/tips, and resources.
This list will be a work in progress and all suggestions are welcomed. Intro to data visualization A Quick Illustrated History of Visualization: Data visualization has its roots in a long historical tradition of representing information using pictures in ways that combine art, science and statistics. Why Data Visualization Matters? Data visualization reveals unnoticed information, especially in large data sets; gives answers faster; and helps journalists investigate cause-effect relationship. Patterns for Information Visualization: in this long article, the author uses some hands-on examples to show how visualization helps people make decisions and work with data.
Data Art vs. Choosing the right chart Stacked Area Chart vs. Datavisualization.ch Selected Tools. Introduction to Circos, Features and Uses // CIRCOS Circular Genome Data Visualization. Cytoscape: An Open Source Platform for Complex Network Analysis and Visualization.
ImageOptim — better Save For Web. Business Guide to Visual Communication by Visage. Documentation. Extensive Java™ class library that provides algorithms and components enabling the analysis, visualization, and the automatic layout of graphs, diagrams, and networks. Knowledge Base Knowledge Base articles for yFiles for Java, which, for example, answer frequently asked questions, or present solutions concerning our products. Developer's Guide The yFiles for JavaFX Developer's Guide contains information about the concepts of the yFiles for JavaFX library: online (HTML) Comprehensive ActionScript™ class library with a full-featured Flex UI component for viewing and editing diagrams in Flex-based web applications.
Knowledge Base articles for yFiles FLEX, which, for example, answer frequently asked questions, or present solutions concerning our products. Extensive class library for the Microsoft Silverlight Framework that provides algorithms and components enabling the analysis, visualization, and the automatic layout of graphs, diagrams, and networks. online (HTML) API Documentation. Datavisualization.ch Selected Tools. Les 20 meilleurs outils de datavisualisation au banc d’essai. Que vous soyez absolument novice ou codeur amateur, il existe aujourd’hui sur le web une impressionnante palette d’outils (presque) gratuits pour réaliser des datavisualisations.
Banc d’essai. Note : j’ai volontairement éliminé les outils (a) entièrement payants (b) trop moches pour être utilisés dans des rédactions (c) en Flash. Ce billet n’est consacré qu’aux outils de “visualisation”, et non de scraping ou de traitement des données (un autre billet suivra bientôt). ↑1 » Pour les novices/pressés : le clé-en-mains Ces outils gratuits ou freemium permettent de générer des graphiques ultra-rapidement en copiant-collant des données d’un tableur. Le meilleur – Datawrapper : Simple d’utilisation, sobre, rapide, Datawrapper est tout à fait satisfaisant pour la plupart des visualisations courantes. Les + : la possibilité de personnaliser les couleurs, de mettre en évidence une série, la navigation par onglets entre les différentes séries.
Les challengers : Ils ne nous ont pas convaincu : 70 Tools And 4 Reasons To Make Your Own Infographics. Infographics are everywhere.
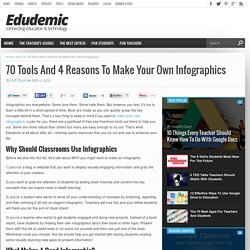
Some love them. Some hate them. But however you feel, it’s fun to learn a little bit in a short period of time. Most are made so you can quickly grasp the key concepts behind them. That’s a key thing to keep in mind if you want to make your own infographics. Why Should Classrooms Use Infographics Before we dive into the list, let’s talk about WHY you might want to make an infographic: 1) you run a blog or website that you want to display visually-engaging information and grab the attention of your readers. 2) you want to grab the attention of students by boiling down theories and content into key concepts that can inspire more in-depth learning. 3) you’re a student who wants to show off your understanding of concepts by analyzing, digesting, and then remixing it all into an elegant infographic. 4) you’re a teacher who wants to get students engaged and doing new projects.
What Makes A Good Infographic? Data Visualization Network of Resources. The top 20 data visualisation tools. It's often said that data is the new world currency, and the web is the exchange bureau through which it's traded.
As consumers, we're positively swimming in data; it's everywhere from labels on food packaging design to World Health Organisation reports. As a result, for the designer it's becoming increasingly difficult to present data in a way that stands out from the mass of competing data streams. Get Adobe Creative Cloud One of the best ways to get your message across is to use a visualization to quickly draw attention to the key messages, and by presenting data visually it's also possible to uncover surprising patterns and observations that wouldn't be apparent from looking at stats alone.
And nowadays, there's plenty of free graphic design software to help you do just that.