
Using Google's Motion Chart to visualize population trends. In my Demographic Dashboard I have a scatter plot that shows the trend towards an aging society. Today I wanted to test the new Google Chart API and the Motion Chart with the same data set. The chart displays the old dependency ratio against young dependency ratio. It clearly shows the shift from high ratios of young dependency to high ratios of old dependency specially in Europe and other developed countries.
This means tough times ahead (the adult population will not be able to pay for social security systems, expensive medical care, etc.). If you click a specific country a persistent label will allow you to track its evolution. If you want to play with the chart click on it to go to the published spreadsheet or follow this link. If you are not familiar with the demographic concepts, this is what you need to know to understand the chart: How to: Comment faire un Google Motion Chart » Article » OWNI, Digital Journalism. Google Motion Chart est un outil puissant et simple d'utilisation qui permet d'interroger facilement un grand nombre de points de données.

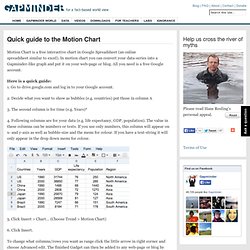
Voici en quelques étapes simples comment réaliser le sien. Faire parler des tableaux de données, c’est pas facile. On peut les décrire à la main, mais c’est long et fastidieux. On peut en faire des visualisations, mais ça coûte cher en design. Il existe une solution idéale, le Google Motion Chart, inspiré de GapMinder. OWNI l’a testé pour expliquer les causes de la crise grecque. Tutoriel par l’exemple : Tentons d’expliquer pourquoi un pays émet du CO2. Quick guide to the Motion Chart Gadget. Motion Chart is a free interactive chart in Google Spreadsheet (an online spreadsheet similar to excel).
In motion chart you can convert your data-series into a Gapminder-like graph and put it on your web-page or blog. All you need is a free Google account. Data Visualization and Business Intelligence from Tableau Softwa. Social Visualization Software Review: Tableau Public - informati. You have no doubt seen a Tableau chart before. They tend to be sleek, interactive, and intuitive. And they have already appeared in the Wall Street Journal, CNN Money, and CBS Sports among other places. The software is loved by many and quickly becoming the industry standard for those who DON'T necessarily consider themselves to be analysts. And it just became much easier for the non-analyst set to create excellent interactive charts with the recent release of Tableau Public, a new tool that puts the power of Tableau into the hands of everyone.
This free version of Tableau was released earlier this year to much fanfare. As you might already know, this is our final review of the big three of free, online social visualization software approaches: Swivel, IBM Many Eyes, and now Tableau Public. We will wrap up with final thoughts next week with a benchmark that would make Tufte proud. Gephi, graph exploration and manipulation software. Data Visualization Review: Gephi, Free Graph Exploration Software. I do not often get to play with networks, yet I find them fascinating and full of knowledge gathering potential.
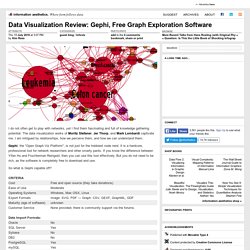
The data visualization works of Moritz Stefaner, Jer Thorp, and Mark Lombardi captivate me. I am intrigued by relationships, how we perceive them, and how we can understand them. Gephi, the "Open Graph Viz Platform", is not just for the hobbiest node nerd. It is a hardcore, professional tool for network researchers and other smarty pants. If you know the difference between Yifan Hu and Fruchterman Reingold, then you can use this tool effectively. So what is Gephi capable off? Gephi interface displaying airline traffic data. Pros — Options! Cons — Interface is a bit cluttered. Main interface displaying the Diseasome data. Review Overall, Gephi is a useful and interesting tool. There are some plugins available for Gephi that extend the functionality. The only thing keeping Gephi from being a professional grade tool is its bugginess and lack of documentation.
Infogr.am: Another Online Editor of Interactive Infographics.