
Eight Free tools for Teachers to Make Awesome Infographics. 1- Easel.ly This is a great tool that allows users to create visually rich infographics from pre-designed themes.
It is very easy to use and only drag and drop. It actually supports Chrome, Firefox, and Safari. 2- Stat Planet This one here allows users to create amazing visualisations and share them with others. It can be used either within your browser or download the software for free. 3- Hohli This is an awesome chart maker. 4- Creately This is also a great tool in creating diagrams and flow charts. 5- Many Eyes This is one of the easiest of them all. The Ultimate Guide To Infographics. What Are Infographics? I found many definitions of what Infographics are as well as explanations of how they are useful in a variety of settings. Here are a couple of the definitions I liked followed by their sources: Information graphics or infographics are graphic visual representations of information, data or knowledge. How To Create An Infographic - With No Discernible Talent Whatsoever.
Click to embiggen I’ve spent weeks testing various tools and trying to figure out an easy way for non-Designers to create Infographics.
My criteria was that the process had to be easy and intuitive and it couldn’t cost an arm and a leg. This means Photoshop and Illustrator were out of the running because they are expensive in terms of learning curve as well as moneys. I’ve tested several other apps. Gimp. Finally, yesterday I’ve stumbled upon a cool little app called Pixelmator that was the answer to my prayers. Comes with a 30 day free trial and I think it’s better than Photoshop simply because it’s easier to use than Photoshop. Note: I am not in any way affiliated with Pixelmator. So, there is my very first Infograph…whadaya guys think? Make Your Images Interactive - ThingLink. Creating Infographics with Students Data Visualization Tools.
Tools And Resources For Creating Infographics. Infographics.
You have probably seen them before. There are so many out there on a wide variety of topics. Here are just a few. (Click the images to see more): These really are a great way to visualize data. Here are a few of my favorite sites and tools to use when creating infographics. Wordle: Chances are this is one you have heard of. Visual.ly: It doesn't get much simpler than using Visual.ly. Stat Silk: This is a set of tools that you can download to create interactive maps and charts. Creately: Creatly is an online mindmapping program that is pretty powerful. Google Public Data Explorer: It probably goes without saying but Google has access to lots of data.
Aviary Phoenix-Once you gather your images, charts and graphics, you are going to need a way to put them together. Kathy Schrock has an entire webiste dedicated to using infographics in the classroom. What other sites do you use to visualize data? The Artist's Toolkit - Lessons on Visual Elements. Easel.ly. Infographics. PowerPoint: Create an Infographic.
By AJ George If you need to create an Infographic, there are better programs than PowerPoint that you could use.
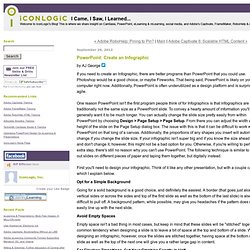
Photoshop would be a good choice, or maybe Fireworks. That being said, PowerPoint is likely on your office computer right now. Additionally, PowerPoint is often underutilized as a design platform and is surprisingly agile. One reason PowerPoint isn't the first program people think of for Infographics is that infographics are traditionally not the same size as a PowerPoint slide. First you'll need to design your infographic. Opt for a Simple Background Going for a solid background is a good choice, and definitely the easiest.
Avoid Empty Spaces Empty space isn't a bad thing in most cases, but keep in mind that these slides will be "stitched" together. For Flawless Transitions, Cut Your Graphics Exactly in Half A good way to fill those empty spaces: set up your graphics so that some of them start on one slide and end on the next seamlessly. Save Your Slides as Images. The Educator’s Guide to Instagram and Other Photo Apps. I’m not the most dedicated Instagrammer (need to get out more) or the best photographer (wish I was) but like many other educators, I enjoy sharing my photos on Instagram.
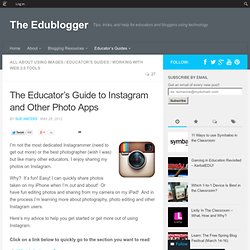
Why? It’s fun! Easy! I can quickly share photos taken on my iPhone when I’m out and about! Or have fun editing photos and sharing from my camera on my iPad! Here’s my advice to help you get started or get more out of using Instagram.Click on a link below to quickly go to the section you want to read: Back to Top What is Instagram? Launched in 2010, Instagram is one of the fastest growing mobile media phenoms; with just over 15 million users at the start of 2012 it now has over 50 million users. Instagram is a free photo sharing app for android and iOS devices that lets users take a photo, apply photo filters and share through a variety of social networking services including Twitter, Facebook, Flickr and on Instagram.
Instagram is popular because: It make sharing photos using mobile devices quick, easy and a lot of fun! Graduates.