
World Migration Map - Data Visualization by Metrocosm. This map shows the estimated net immigration (inflows minus outflows) by origin and destination country between 2010 and 2015.
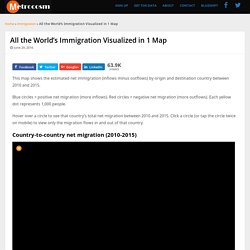
Blue circles = positive net migration (more inflows). Red circles = negative net migration (more outflows). Each yellow dot represents 1,000 people. Hover over a circle to see that country’s total net migration between 2010 and 2015. Danny Dorling: Maps that show us who we are (not just where we are) Before-and-After Images Reveal Astounding Urban Growth in China. Geographyalltheway.com - Online Geography and Humanities Resources. Infographic: How Climate Change Is Destroying the Earth. Four Corners 50 Years - Home. Welcome to a celebration of 50 years of ABC Television’s premier News and Current Affairs program, Four Corners.

This website is a celebration of our history, which is not only TV programs, it is the successful collaboration of people: executive producers, reporters, researchers, editors, producers, crews and administrators, all of whom have played a significant role in the program’s history, identity and success, from 1961 to the present day.
Four Corners’ reports have explored cultural and social change, political upheaval, conflicts, disasters and terrorism, with an eye on national and international events. This website will showcase the key stories, people and events we have covered over the past 50 years, and will stand as a living archive to five decades of vigorous reporting on ABC TV. You can explore our vast archive of programs by decade or by theme. The website also presents extended interviews with reporters, executive reporters, researchers and cameramen.
POPULATION RESOURCES. 2015 Gates Annual Letter EN. 2015 Gates Annual Letter. There is overwhelming evidence that people care about others who are suffering—when they can see the suffering.

Just think of the global outpouring of support whenever a devastating tsunami or earthquake makes the news. The problem is that ongoing tragedies like deadly diseases and poverty don’t make the news. They’re invisible to many of us. Chinawater. China Has Launched the Largest Water-Pipeline Project in History. BEIJING—On a Saturday morning in late August, about a dozen university students, professors, and middle-aged Beijing locals stand by a row of apartments in northwestern Beijing.
Once an outskirt of the city known for its natural springs and reed-filled ponds, the area now looks just like another part of the sprawling capital: wide roads lined with set-back buildings, crowded with pedestrians. China’s Environmental Crisis. Introduction China's environmental crisis is one of the most pressing challenges to emerge from the country's rapid industrialization.
Its economic rise, which has averaged around 10 percent annual GDP growth for the past decade, has come at the expense of its environment and public health. Biodiversity. How to Tell Stories with Maps. School of Data has published a good round-up of narrative mapping platforms.
The article includes a few examples of good story maps and explores some of the mapping libraries which can be used to create interactive maps to annotate or narrate a story. Seven Ways to Create a Storymap reviews popular narrative mapping libraries such as Knight Lab's StoryMap JS, Esri StoryMaps and CartoDB's Odyssey.js. It even mentions my own story map demo created using waypoints.js with Leaflet, JourneyMap.
Gapminder: Unveiling the beauty of statistics for a fact based world view. ChartsBin.com - Visualize your data. Worldmapper: The world as you've never seen it before. Encyclopedia of Earth. How Earth Made Us. The incredible story of the natural forces that have shaped our history presented by Professor Iain Stewart.
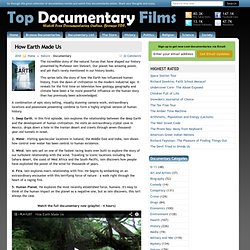
Our planet has amazing power, and yet that's rarely mentioned in our history books. This series tells the story of how the Earth has influenced human history, from the dawn of civilization to the modern industrial age. It reveals for the first time on television how geology, geography and climate have been a far more powerful influence on the human story than has previously been acknowledged. A combination of epic story telling, visually stunning camera-work, extraordinary locations and passionate presenting combine to form a highly original version of human history. 1. 2.
Sacred Spirit of Water. Water is a living organism, water is sacred, water is life, water is worth defending and protecting for those yet unborn.
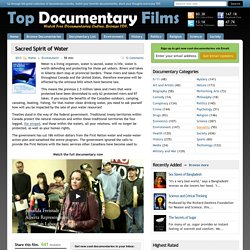
Rivers and lakes in Alberta don't stop at provincial borders. These rivers and lakes flow throughout Canada and the United States, therefore everyone will be affected by the ominous bills which have become law. This means the previous 2.5 million lakes and rivers that were protected have been diminished to only 62 protected rivers and 97 lakes. If you enjoy the benefits of the Canadian outdoors, camping, canoeing, boating, fishing, for that matter clean drinking water, you need to ask yourself how will you be impacted by the sale of your water resources? A World Without Water. Poison Fire (2008) The Niger Delta is an environmental disaster zone after fifty years of oil exploitation.
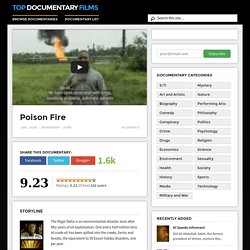
One and a half million tons of crude oil has been spilled into the creeks, farms and forests, the equivalent to 50 Exxon Valdez disasters, one per year. Natural gas contained in the crude oil is not being collected, but burnt off in gas flares, burning day and night for decades. The flaring produces as much greenhouse gases as 18 million cars and emits toxic and carcinogenic substances in the midst of densely populated areas. Corruption is rampant, the security situation is dire, people are dying.
Lochiel Park - Australia's Model Green Village is here. World Geography Map. Geography is the scientific study of the earth's surface and the World Geography Map depicts both the earth's physical features and the human phenomena on its surface that is the result of man's interaction with his physical environment.
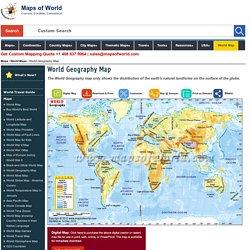
The World Geography map therefore not only shows the distribution of the earth's natural landforms on the surface of the globe but also depicts the elements of human intervention such as political boundaries and the division of the world into countries and independent states together with their capitals and principle cities. Atlas of Living Australia. 40 Maps That Will Help You Make Sense of the World. If you’re a visual learner like myself, then you know maps, charts and infographics can really help bring data and information to life. Maps can make a point resonate with readers and this collection aims to do just that. Hopefully some of these maps will surprise you and you’ll learn something new. Water.
Water Image source: Geography for 2014 & Beyond - Home. Social Studies, Government, and Geography. Bio.Diaspora: Visualising interactions between populations and travel. I want to share some impressive work I’ve recently come across from a Toronto-based project/group called Bio.Diaspora. Last week the team was featured in the Lancet Infectious Disease Journal as part of a special report on Mass Gatherings and Health.
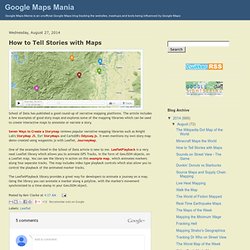
Interactive - NatGeoMag Population. The World of Seven Billion The map shows population density; the brightest points are the highest densities. Each country is colored according to its average annual gross national income per capita, using categories established by the World Bank (see key below).
Some nations— like economic powerhouses China and India—have an especially wide range of incomes. But as the two most populous countries, both are lower middle class when income is averaged per capita. Human Geography - Free Powerpoints. 11 & 12 GEOGRAPHY LINKS.