
Principles of Data Visualization. Edward Tufte. Edward Rolf Tufte (/ˈtʌfti/; born 1942) is an American statistician and professor emeritus of political science, statistics, and computer science at Yale University.[1] He is noted for his writings on information design and as a pioneer in the field of data visualization.[2] Biography[edit] Edward Rolf Tufte was born in 1942 in Kansas City, Missouri, to Virginia Tufte and Edward E.
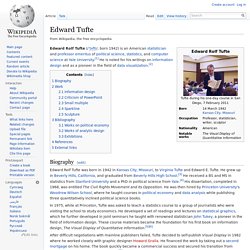
Tufte. Envisioning Information. The Visual Display of Quantitative Information. Tufte, Edward. Edward Tufte is a statistician and artist, and Professor Emeritus of Political Science, Statistics, and Computer Science at Yale University.

He wrote, designed, and self-published 4 classic books on data visualization. The New York Times described ET as the "Leonardo da Vinci of data," and Business Week as the "Galileo of graphics. " He is now writing a book/film The Thinking Eye and constructing a 234-acre tree farm and sculpture park in northwest Connecticut, which will show his artworks and remain open space in perpetuity. He founded Graphics Press, ET Modern gallery/studio, and Hogpen Hill Farms LLC. Tufte, Edward: Data Analysis for Politics and Policy: Contents/Preface. Visual Explanations: Quantities, Evidence.