
D3.js - Data-Driven Documents. Parallel Sets. Parallel Sets (ParSets) is a visualization application for categorical data, like census and survey data, inventory, and many other kinds of data that can be summed up in a cross-tabulation. ParSets provide a simple, interactive way to explore and analyze such data. Even though the screenshots here show the Mac version, the program also runs on Windows and Linux. Links to the executables are in the Download Section. Basic Operation To open an existing dataset, select it in the list and either double-click it or click the Open button. The horizontal bars in the visualization show the absolute frequency of how often each category occurred: in this example, the top line shows the distribution between the passenger classes on the Titanic and the crew.
The middle dimension shows a male to female ratio of almost 4 to 1. Between the dimension bars are ribbons that connect categories and split up. Interaction Move your mouse over the display to see the tooltip telling you more about the data. SIMILE Widgets. FRED - data tools. StatCrunch - Data analysis on the Web. Weave (Web-based Analysis and Visualization Environment) VIDI.
Google Chart Tools API. Google Charts provides a perfect way to visualize data on your website.
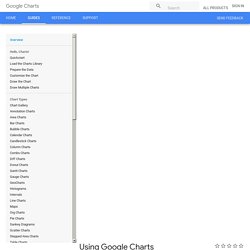
From simple line charts to complex hierarchical tree maps, the chart gallery provides a large number of ready-to-use chart types. The most common way to use Google Charts is with simple JavaScript that you embed in your web page. You load some Google Chart libraries, list the data to be charted, select options to customize your chart, and finally create a chart object with an id that you choose. Then, later in the web page, you create a <div> with that id to display the Google Chart. That's all you need to get started. Charts are exposed as JavaScript classes, and Google Charts provides many chart types for you to use.
All chart types are populated with data using the DataTable class, making it easy to switch between chart types as you experiment to find the ideal appearance. Ready to create your first chart? Flex-cb - Creating useful visualizations of statistical data from institutions that employ SDMX. Open source analysis OLAP server written in Java. Enabling interactive analysis of very large datasets stored in SQL databases without writing SQL. Drive - Google Fusion Tables. Space-Time Research. Ckan - The open source data portal software. StatPlanet. StatPlanet (formerly StatPlanet Map Maker) is a free, award-winning application for creating fully customizable interactive maps.
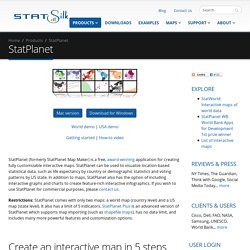
StatPlanet can be used to visualize location-based statistical data, such as life expectancy by country or demographic statistics and voting patterns by US state. In addition to maps, StatPlanet also has the option of including interactive graphs and charts to create feature-rich interactive infographics. If you wish to use StatPlanet for commercial purposes, please contact us. Restrictions: StatPlanet comes with only two maps: a world map (country level) and a US map (state level).
It also has a limit of 5 indicators. Create an interactive map in 5 steps Open StatPlanet.exe to view the results offline, or open StatPlanet.html to view the results in a web-browser. For further details, see the StatPlanet User Guide (PDF) Create an interactive map in 5 minutes instructional video Enable macros in Excel. Beyond 20/20 Web Data Server 8.2. Tableau.
TIBCO Spotfire - Business Intelligence Analytics Software & Data Visualization. Qlikview. Socrata. Datawrapper.