
Conjunction, Negation, and Disjunction. E. g., suppose Alice and Betty are in this room, but Charles is not.
The form of the statement corresponding to each person being in the room is [(p q) r]and the statement "Alice is in this room and Betty is in this room, and Charles is in this room" can, itself, be symbolized as[(A B) C]The truth of the compound expression is analyzed by substituting in the truth values corresponding to the facts of the case, viz., [(T T) F]so by the meaning of the " " the compound statement resolves to being false by the following step-by-step analysis in accordance with the truth table for conjunction: [(T T) F] [( T ) F] [ T F] F. Il tensore metrico. Reference request - Where can I find examples of good Mathematica programming practice? Calcolo delle probabilita' Per il calcolo delle probabilita' di eventi composti, sono particolarmente utili alcuni teoremi che permettono di calcolare la probabilita' degli eventi composti in funzione delle probabilita' degli eventi componenti.
Teorema delle probabilita' totali. Consideriamo un esperimento che dia luogo ad uno spazio campionario U. Siano a e b due eventi e consideriamo l'evento composto "a+b". Vogliamo calcolare la probabilita' di "a+b".
Project Jupyter. Graphic. Fun. Control systems. Hyperbolic Paraboloids. Erik Demaine, Martin Demaine, and Anna Lubiw A hyperbolic paraboloid is an infinite surface in three dimensions with hyperbolic and parabolic cross-sections.
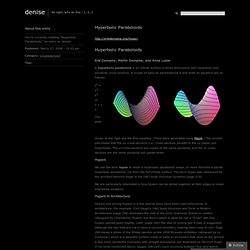
A couple of ways to parameterize it and write an equation are as follows: z2 = x2 – y2 orx = y z The plots shown to the right use the first equation. (They were generated using Maple.) Averaging Quaternions and Vectors. Quaternion Averaging This code will calculate the average rotation of various separate quaternions.
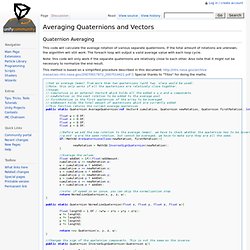
If the total amount of rotations are unknown, the algorithm will still work. The foreach loop will output a valid average value with each loop cycle. Changing default meaning of ImageSize -> Automatic - Google Gruppi. Graphics - Changing default ImageSize in the frontend? ----------------------- Variant 1 Increase magnification of the whole notebook by changing % number in the notebook bottom right corner (alternatively hold CTRL key and rotate mouse wheel).
Pros: simpleCons: magnifies everything ----------------------- Variant 2 If you know which functions you need it for (let's say Plot), at the beginning of your work execute: SetOptions[Plot, ImageSize -> {800, 700}] {800, 700} means your own custom size.
Simple, fast compiled peak detection based on moving average - Wolfram Community. Recently Christopher coded a neat wavelet-based method for peak detection.
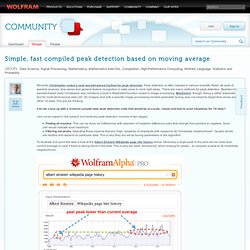
Peak detection is often needed in various scientific fields: all sorts of spectral analysis, time series and general feature recognition in data come to mind right away. There are many methods for peak detection. Besides his wavelet-based code Christopher also mentions a built-in MaxDetect function rooted in image processing. MaxDetect, though, being a rather elaborate tool for multi-dimensional data (2D, 3D images) and with a specific image-processing-minded parameter tuning, was not meant to target time series and other 1D data. This got me thinking. Keshavsaharia/ArduinoLink. Mathematica - Using a struct to pass parameters by reference.
Player Pro: Developer Guidelines for Compatibility. Comparing Matlab and Mathematica - by walkiria. Walkiria's image for: "Comparing Matlab and Mathematica" Caption: Location: Image by: The comparison between Matlab and Mathematica is NOT numeric versus symbolic as some claim.

Much of the wider functionality for Matlab is sold as additional toolboxes. e.g. Fun with Mathematica: Extract elevation data with Google Elevation Service. In the previous post: Extract elevation data from Google Earth, Google Earth COM API is used, it only works on Windows platform.
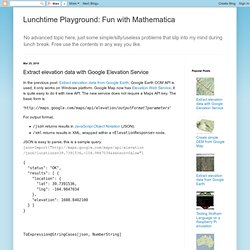
Google Map now has Elevation Web Service, it is quite easy to do it with new API. The new service does not require a Maps API key. The basic form is. Visualize a Satellite Path with Wolfram SystemModeler and Mathematica. Today we rely heavily on satellites orbiting Earth for a variety of purposes.
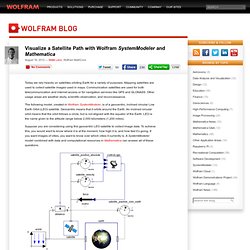
Mapping satellites are used to collect satellite images used in maps. Communication satellites are used for both telecommunication and internet access or for navigation services like GPS and GLONASS. Cellular automata. Main Introduction Download Examples Links Participants CAPOW (Cellular Automata for Electric Power simulation) is a research project of Rudy Rucker's which was born under the CAMCOS program at San Jose State University . Since 1994 CAPOW has been exploring new kinds of continuous-valued cellular automata. With funding from EPRI from 1994-1998, Rucker and his students devloped Capow 98, a flexible and easily programmable Windows application for simulating and analyzing one-dimensional and two-dimensional cellular automata.
The targeted purpose was to produce visualizations of electricital wave forms. You can get an idea of the scope of the program by viewing a version of the help file online . Www.ross.net/crc/download/crc_v3.txt. Image processing - Download xkcd Click and Drag comic - Mathematica. Inspired by the recent question about xkcd styled plots I started looking at xkcd again and I came across a comic titled Click and Drag.
And if you do that, you start exploring a larger drawing. A much larger drawing. How large? I don't know, but I spent about half and hour exploring it before my arm wore out. Now I want to see all the comic but I don't want to give myself RSI in the process. How can I use Mathematica to download the entire scrollable drawing? MathLink Development in C (Mac OS X) Html - Google Map in Notebooks? - Mathematica. All we need to create an interactive Google Map in the notebook is access to the individual tiles - and there is a relatively simple naming scheme for those tiles. I actually typed up a description of this naming scheme a few years ago and posted it here: The examples on that page show the full blown URLs used by the GMap API, but you don't need the full URL to access the tiles. For example, I live in the tile shown here: The webpage above describes the basics of translating from lat/lng values to tile indices. We can implement this in Mathematica as follows.
Static Maps API V2 Developer Guide - Google Maps Image APIs. The Google Static Maps API lets you embed a Google Maps image on your web page without requiring JavaScript or any dynamic page loading. The Google Static Map service creates your map based on URL parameters sent through a standard HTTP request and returns the map as an image you can display on your web page. New! The Google Static Maps API Usage Limits have changed. Creating an API key and including it in your request allows you to track usage in the APIs Console, and to purchase additional quota if required. This document details the Static Maps API v2. GE in java application - Google Gruppi. The HyperSphere. The mathematical objects that live on the sphere in four dimensional space -- the hypersphere -- are both beautiful and interesting. The four dimensional sphere is a unique object, with properties both similar to and surprisingly different from those of our ordinary sphere.
Similarly to the case in three dimensions, there is a family of Platonic and Archimedean solids that can be viewed on the four dimensional sphere. These shapes can be seen to have a structure that is comfortingly analogous to that of the Platonic solids we know and love. However, there are some properties of the four dimensional sphere that are startlingly different.
Stereographic projection of Paris.jpg - Wikipedia, the free encyclopedia.