
New Study Shows CO2 Changes Lag Decadal-Scale Warming By ~1000 Years In The Northern Hemisphere. By Kenneth Richard on 16.

July 2020 From about 80,000 to 20,000 years ago, Greenland temperatures abruptly warmed by about 10°C in just a few decades on at least 20 occasions. And then, about 870 to 1,500 years later, CO2 rose. Cooling The Hothouse. Guest Post by Willis Eschenbach I see that a new study has been hyped with the headline: I’ll spare you a link to the miscreants in question, it’s the usual alarmism.
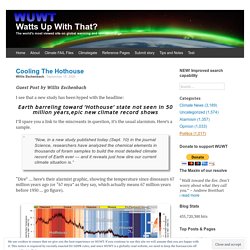
Here’s a sample. “Now, in a new study published today (Sept. 10) in the journal Science, researchers have analyzed the chemical elements in thousands of foram samples to build the most detailed climate record of Earth ever — and it reveals just how dire our current climate situation is.” “Dire” … here’s their alarmist graphic, showing the temperature since dinosaurs 67 million years ago (or “67 mya” as they say, which actually means 67 million years before 1950 … go figure). Figure 1. Y’all know me, I’m a data hound. Figure 2. The first thing I noticed was that their main Figure was quite different from the figure in the press release.
Next, I never believe anything without running the numbers myself. There’s an oddity in Figures 1 & 2 just above. Figure 3. Increased! And it’s even worse than the graph shows. ∆T = λ ∆F w. CO2’s Influence Was 0.006 W/m² Per Decade During The Last Deglaciation. And This Melted Ice Sheets How? According to the calculations of Dr.

James Hansen, the radiative influence derived from the increase in CO2 during the last deglaciation was so negligible that it equated to “a third of energy required to power a honey bee in flight” (Ellis and Palmer, 2016). Image Source: Ellis and Palmer, 2016 Between about 22,000 and 17,000 thousand years ago, Earth’s sea levels were about 120 meters lower than they are now because much of the Earth’s seawater was locked up in kilometers-thick continental ice sheets. Then, about 14,500 years ago, nearly the entire Northern Hemisphere abruptly warmed up by about 4-5°C within a span of about 20-30 years as sea levels rose at rates between 3 and 6 meters per century (Ivanovic et al., 2017).
Northern Hemisphere sea surface temperatures warmed by 3°C in less than 90 years during this time. Image Source: Ivanovic et al., 2017. Another New Paper Reveals No Discernible Human Influence On Global Ocean Temperatures, Climate. Three years ago, when the Rosenthal et al. (2013) paper was made available online from the journal Science, there was a bit of a stir among the purveyors of the humans-control-climate-with-their-CO2-emissions paradigm.

Climate activist Michael Mann, for example, was ostensibly quite unhappy that a Medieval Warm Period (with +0.65°C warmer-than-now intermediate [0-700 m] ocean temperatures) was prominently identified in the paper’s abstract, and that both the Medieval Warm Period and Little Ice Age were characterized as “global events” in the summary. These conclusions served to undermine his own tree-ring hockey-stick reconstructions that effectively made the inconvenient Medieval Warm Period disappear. None of the graphs from the paper depicted anything resembling a “hockey stick” for recent decades, which is probably why Mann claimed the paper was “suspect” and contained “a number of inconsistencies” and “debatable assumptions and interpretations”. 108 Graphs From 89 New Papers Invalidate Claims Of Unprecedented Global-Scale Modern Warmth. By Kenneth Richard on 2.

August 2018 During 2017, there were 150 graphs from 122 scientific papers published in peer-reviewed journals indicating modern temperatures are not unprecedented, unusual, or hockey-stick-shaped — nor do they fall outside the range of natural variability. We are a little over halfway through 2018 and already 108 graphs from 89 scientific papers undermine claims that modern era warming is climatically unusual. For the sake of brevity, just 13 (15%) of the 89 new papers are displayed below. The rest of the non-hockey-stick scientific papers and graphs published thus far in 2018 can be viewed by clicking the link below. 150 NON-Global Warming Graphs From 2017 Pummel Claims Of Unusual Modern Warmth.
By Kenneth Richard on 1.
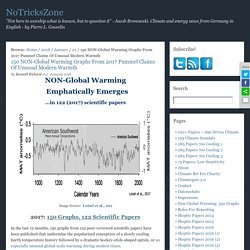
January 2018 …in 122 (2017) scientific papers Image Source: Loisel et al., 201 2017: 150 Graphs, 122 Scientific Papers. 50 Inverted Hockey Sticks – Scientists Find Earth Cools As CO2 Rises. Modern ‘Warmth’ A Brief Excursion From 8,000-Year (Continuing) Cooling Trend The scientific literature is replete with evidence that the geological record for the Holocene (the last 10,000 years) fails to support the concept that rising atmospheric CO2 concentrations cause ocean and land temperatures to rise.

Actually, the scientific literature strongly suggests that the correlation between rising CO2 and temperature would appear to veer off in the opposite direction: as CO2 rises, temperatures decline. So if there is a correlation for the Holocene, it may be the inverse of climate model expectations. 200 Non-Hockey Stick Graphs Published Since 2017 Invalidate Claims Of Unprecedented, Global-Scale Warming. By Kenneth Richard on 22.
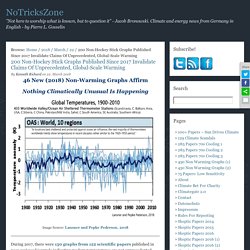
March 2018 46 New (2018) Non-Warming Graphs Affirm Nothing Climatically Unusual Is Happening Image Source: Lansner and Pepke Pederson, 2018. 81 Graphs From 62 New (2018) Papers Invalidate Claims Of Unprecedented Global-Scale Modern Warming. By Kenneth Richard on 10.

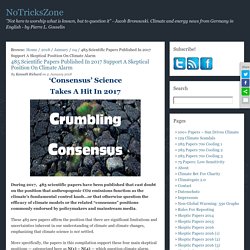
May 2018 During 2017, there were 150 graphs from 122 scientific papers published in peer-reviewed journals indicating modern temperatures are not unprecedented, unusual, or hockey-stick-shaped — nor do they fall outside the range of natural variability. We are a little over 4 months into the new publication year and already 81 graphs from 62 scientific papers undermine claims that modern era warming is climatically unusual. Zheng et al., 2018. 485 Scientific Papers Published In 2017 Support A Skeptical Position On Climate Alarm.
During 2017, 485 scientific papers have been published that cast doubt on the position that anthropogenic CO2 emissions function as the climate’s fundamental control knob…or that otherwise question the efficacy of climate models or the related “consensus” positions commonly endorsed by policymakers and mainstream media.
These 485 new papers affirm the position that there are significant limitations and uncertainties inherent in our understanding of climate and climate changes, emphasizing that climate science is not settled. More specifically, the papers in this compilation support these four main skeptical positions — categorized here as N(1) – N(4) — which question climate alarm. N(2) The warming/sea levels/glacier and sea ice retreat/hurricane and drought intensities…experienced during the modern era are neither unprecedented or remarkable, nor do they fall outside the range of natural variability, as clearly shown in the first 150 graphs (from 2017) on this list. Part 1. Part 2. 80 Graphs From 58 New (2017) Papers Invalidate Claims Of Unprecedented Global-Scale Modern Warming.
By Kenneth Richard on 29. Inconvenient: New paper finds the last interglacial was warmer than today – not simulated by climate models. [Reposted from the Hockey Schtick] A new paper published in Climate of the Past compares temperature reconstructions of the last interglacial period [131,000-114,000 years ago] to climate model simulations and finds climate models significantly underestimated global temperatures of the last interglacial by ~0.67C on an annual basis and by ~1.1C during the warmest month. This implies that climate models are unable to fully simulate natural global warming, and the error of the underestimation is about the same as the 0.7C global warming since the end of the Little Ice Age in ~1850.
Thus, the possibility that present-day temperatures could be entirely the result of natural processes cannot be ruled out in comparison to the last interglacial period. Further, during the last interglacial, Greenland temperatures were naturally up to 8C higher and sea levels up to 43 feet higher than today. Clim. Last interglacial model–data mismatch of thermal maximum temperatures partially explained P. 8 New Papers Reveal ‘Natural’ Global Warming Reaches Amplitudes Of 10°C In Just 50 Years With No CO2 Influence. Climate records from ice cores indicate that abrupt, global-scale warming events with amplitudes of up to 10°C (in the Greenland region) were reached within as little as 50 years dozens of times during the roughly 100,000 years between the last interglacial (~120,000 years ago) and the current interglacial period (11,700 years ago to present).
That’s equivalent to a rate of up to 2.0°C per decade of “natural” global warming. CO2 concentrations remained flat and low (~180 parts per million) throughout these warming (and cooling) periods, commonly referred to as Dansgaard-Oeschger events. New Paper Asserts ‘Biased’ Climate Models Underestimate Natural Variability And The Warmth Of The Past. By Kenneth Richard on 20. April 2017 Reconstructions Of Northern Hemisphere Temperatures Indicate Medieval Period Was As Warm As Recent Decades Abrantes et al., 2017 Otto and Roberts, 2016 Other NH Reconstructions Indicate Pre-Industrial Temps Were Highly Variable, 1940s As Warm As 2000s Schneider et al., 2015 Stoffel et al., 2015 New Paper: Models Need ‘Forcing’ Adjustment…Underestimate Past Warmth, Internal Variability…Instrumental Record ‘Biased’ Büntgen et al., 2017 Spanning the period 1186-2014 CE, the new reconstruction reveals overall warmer conditions around 1200 and 1400, and again after ~1850.
Distinguishing Between ‘Safe’ or ‘Dangerous’ Warming Is Easy: ‘Dangerous’ Warming Is Red. 10 New Reconstructions Show Today’s Temperatures Still Among The Coldest Of The Last 10,000 Years. By Kenneth Richard on 10. ‘Hide The Decline’ Unveiled: 50 Non-Hockey Stick Graphs Quash Modern ‘Global’ Warming Claims. The Hockey Stick Collapses: 60 New (2016) Scientific Papers Affirm Today’s Warming Isn’t Global, Unprecedented, Or Remarkable. Two fundamental tenets of the anthropogenic global warming narrative are (1) the globe is warming (i.e., it’s not just regional warming), and (2) the warming that has occurred since 1950 can be characterized as remarkable, unnatural, and largely unprecedented.
In other words, today’s climate is substantially and alarmingly different than what has occurred in the past….because the human impact has been profound. Well, maybe not. Scientists are increasingly finding that the two fundamental points cited above may not be supported by the evidence. In 2016, an examination of the peer-reviewed scientific literature has uncovered dozens of paleoclimate reconstructions that reveal modern “global” warming has not actually been global in scale after all, as there are a large number of regions on the globe where it has been cooling for decades.
The Proliferation Of Non-Global Warming Graphs In Science Journals Continues Unabated In 2018.