

Data Visualisation Examples. Data Visualisation Examples. Piximilar Visual Search - Idée Inc. - The Visual Search Company. Creativity - Part 2. 10 MARCH, 2014By: Maria Popova The lost art of learning to stand “where we would rather not and expand in ways we never knew we could.”
“You gotta be willing to fail… if you’re afraid of failing, you won’t get very far,” Steve Jobs cautioned. “There is no such thing as failure — failure is just life trying to move us in another direction,” Oprah counseled new Harvard graduates. In his wonderfully heartening letter of fatherly advice, F. Scott Fitzgerald gave his young daughter Scottie a list of things to worry and not worry about in life; among the unworriables, he listed failure, “unless it comes through your own fault.”
Female archers, lantern slide, c. 1920. There is little that is vocational about [contemporary] culture anymore, so it is rare to see what doggedness looks like with this level of exactitude… To spend so many hours with a bow and arrow is a kind of marginality combined with a seriousness of purpose rarely seen. Mastery requires endurance. Thomas Edison Frederick Douglass. Visualisation Magazine.
Blog - The Crisis of Credit Visualized. The Crisis of Credit Visualized. Patrick Clair. Blog. Last week, during an hackathon in Amsterdam, we realized the first working prototype of Contropedia Platform, an application meant for the real-time analysis and visualization of controversies in Wikipedia.
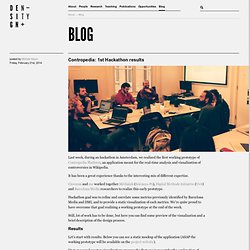
It has been a great experience thanks to the interesting mix of different expertise. Giovanni and me worked together Médialab (Sciences-Po), Digital Methods Initiative (UvA) and Barcelona Media researchers to realize this early prototype. Hackathon goal was to refine and correlate some metrics previously identified by Barcelona Media and DMI, and to provide a static visualization of each metrics. We’re quite proud to have overcome that goal realizing a working prototype at the end of the week. Still, lot of work has to be done, but here you can find some preview of the visualization and a brief description of the design process.
Results Let’s start with results. Preliminary Work Before the hackathon, each institution prepared some preliminary work. User scenario Metrics Working groups. Overview. This tutorial is for Processing 2+.
If you see any errors or have comments, please let us know. This tutorial is adapted from the book, Visualizing Data by Ben Fry, O'Reilly 2007. Processing is a simple programming environment that was created to make it easier to develop visually oriented applications with an emphasis on animation and providing users with instant feedback through interaction. The developers wanted a means to “sketch” ideas in code. As its capabilities have expanded over the past decade, Processing has come to be used for more advanced production-level work in addition to its sketching role. Processing is based on Java, but because program elements in Processing are fairly simple, you can learn to use it even if you don't know any Java. The latest version of Processing can be downloaded at An important goal for the project was to make this type of programming accessible to a wider audience. Processing consists of: The Processing Development Environment (PDE).
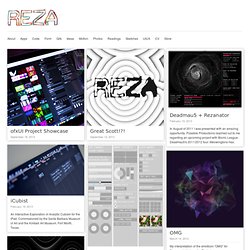
Hello world. GeoCommons. Data Visualization, Infographics, and Statistics. Startin' Somethin': Archive. Reza Ali. C++, code art, GUI, Inspiration, iOS, iPad, ofxUI, open source, OpenFrameWorks, OpenGL, Special Effects, Technology, UI Design, User Interface Algorithmic, Art, C++, code art, Computational Design, Design, Generative, GLSL, Graphic Design, Gray Scott, Inspiration, ofxUI, OpenFrameWorks, OpenGL, Prototyping, Reaction Diffusion, Reza, Simulation, Visualization, Visuals Algorithmic, C++, Computational Design, Design, EDM, Freelance, Generative, ofxUI, OpenFrameWorks, OpenGL, Particles, production, Reza, Simulation, Special Effects, Technology, vfx, Visuals, VJ Deadmau5 + Rezanator February 19, 2013 In August of 2011 I was presented with an amazing opportunity.
CreativeApplications.Net. Extracts of local distance. Plumage: FineFlickrFeathers. Treegrowth. Blprnt.blg. Converge to Inspire. Visualizing.org. My First Tweet: Find Your First Words. IOGraphica — MousePath's new home. Bloom: new ways to see and communicate. Login.
Fizz — Social Network Visualization — by Bloom. Goodsie : Goodsie. Blog. The Infographic Battle IC14nl 2014-03-14 - Nicholas Felton Create your own mind maps at MindMeister Yael de Haen Create your own mind maps at MindMeister Geert en Frederik Create your own mind maps at MindMeister Frederik Ruijs | | Nieuws Nicholas Felton workshop: limited seatings!
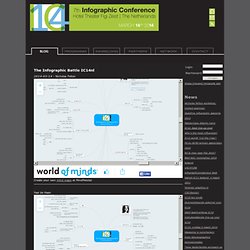
2014-02-25 - Prior to the Dutch Infographic Conference in Zeist, Nicholas Felton will host an exclusive one day workshop at BNO headquarters in Amsterdam on March 13th, 2014. Download PDF or book your ticket (full day workshop + IC14 conference, incl. food and drinks € 495 incl. Presenting line-up of IC14 2014-01-17 - This year's conference IC14 is all about Visualizing Me: about quantifying yourself in the age of big data. Petra Grijzen Moderator Nicholas Felton The Feltron Reports Prof. Infographics: the peak of inflation 2013-03-24 - De populariteit van infographics is in Nederland de laatste jaren geexplodeerd. Frederik Ruijs | | Nieuws Verzamelde werken staan hier. Tools on Datavisualization.
A Carefully Selected List of Recommended Tools 07 May 2012 Tools Flash, JavaScript, Processing, R When I meet with people and talk about our work, I get asked a lot what technology we use to create interactive and dynamic data visualizations.
To help you get started, we have put together a selection of the tools we use the most and that we enjoy working with. Read more Pathline: Connecting Designers With Scientists 18 Apr 2012 Tools We recently attended an interdisciplinary visualization workshop that was all about creating a dialogue between scientists, technologists and designers. New Maps for the Web by Stamen 22 Mar 2012 Tools JavaScript, Mapping I just left the Stamen studio where I had a brief chat with founder and CEO Eric Rodenbeck.
Data Visualization /Communication : un album.