
Choosing the Right Statistical Test. Statistical tests are used in hypothesis testing.
They can be used to: determine whether a predictor variable has a statistically significant relationship with an outcome variable.estimate the difference between two or more groups. Statistical assessment of MMSE scores. Types of Statistical Tests. After looking at the distribution of data and perhaps conducting some descriptive statistics to find out the mean, median, or mode, it is time to make some inferences about the data.
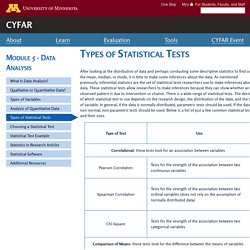
As mentioned previously, inferential statistics are the set of statistical tests researchers use to make inferences about data. These statistical tests allow researchers to make inferences because they can show whether an observed pattern is due to intervention or chance. Statsinfographic03.jpg (JPEG Image, 1123 × 1687 pixels) - Scaled (59%) Selecting Statistics. Choosing a statistical test - FAQ 1790 - GraphPad. This is chapter 37 of the first edition of Intuitive Biostatistics by Harvey Motulsky.
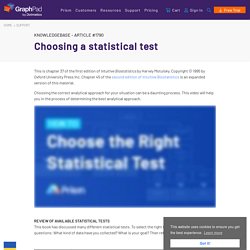
Copyright © 1995 by Oxford University Press Inc. THE DECISION TREE FOR STATISTICS. The material used in this guide is based upon "A Guide for Selecting Statistical Techniques for Analyzing Social Science Data," Second Edit ion, produced at the Institute for Social Research, The University of Michigan, under the authorship of Frank M.

Andrews, Laura Klem, Terrence N. Davidson, Patrick O'Malley, and Willard L. Rodgers, copyright 1981 by The University of Michigan, All Rights Reserved. This electronic version copyright 2014 by Neal Van Eck. How to choose the right statistical test? How to choose the correct statistical test - a rough guide - Smart Vision - Europe. Choosing the Correct Statistical Test in SAS, Stata, SPSS and R.
The following table shows general guidelines for choosing a statistical analysis.
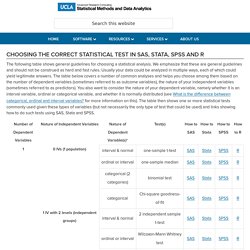
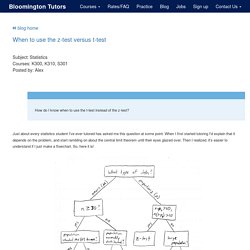
We emphasize that these are general guidelines and should not be construed as hard and fast rules. Usually your data could be analyzed in multiple ways, each of which could yield legitimate answers. The table below covers a number of common analyses and helps you choose among them based on the number of dependent variables (sometimes referred to as outcome variables), the nature of your independent variables (sometimes referred to as predictors). You also want to consider the nature of your dependent variable, namely whether it is an interval variable, ordinal or categorical variable, and whether it is normally distributed (see What is the difference between categorical, ordinal and interval variables? More Correlation Coeficients. Back to the Table of Contents Lesson Overview Why so many Correlation Coefficients We introduced in lesson 5 the Pearson product moment correlation coefficient and the Spearman rho correlation coefficient.
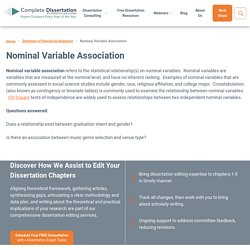
There are more. Tutorsquickguidetostatistics. When to use the z-test versus t-test. How do I know when to use the t-test instead of the z-test?
Just about every statistics student I've ever tutored has asked me this question at some point. When I first started tutoring I'd explain that it depends on the problem, and start rambling on about the central limit theorem until their eyes glazed over. Then I realized, it's easier to understand if I just make a flowchart. So, here it is! Basically, it depends on four things: Whether we are working with a mean (for example, "37 students") or a proportion (e.g., "15% of all students").Whether or not we know the population standard deviation ().
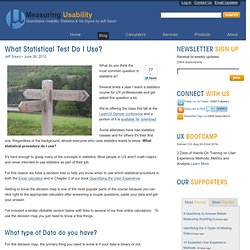
OrdinalIndependent. Effective analysis of reaction time data. 1000+ images about Statistics on Pinterest. 1000+ images about Statistics on Pinterest. Statistical Test Calculators. Nominal Variable Association - Statistics Solutions. Nominal variable association refers to the statistical relationship(s) on nominal variables.
Nominal variables are variables that are measured at the nominal level, and have no inherent ranking. Examples of nominal variables that are commonly assessed in social science studies include gender, race, religious affiliation, and college major. ProperTest 1. Stats_test_selection_reading.pdf. Hypothesis Testing in Six Sigma. Stats_flow_chart_v2014.pdf. Besttest.jpg (JPEG Image, 569 × 949 pixels) What Statistical Test do I Use? Jeff Sauro • June 26, 2012 What do you think the most common question in statistics is?
Several times a year I teach a statistics course for UX professionals and get asked this question a lot. We're offering the class this fall at the LeanUX Denver conference and a portion of it is available for download. Some attendees have had statistics classes and for others it's their first one. Choosing Statistical Tests. Choosing the best test. Statistical Distributions. Every statistics book provides a listing of statistical distributions, with their properties, but browsing through these choices can be frustrating to anyone without a statistical background, for two reasons.
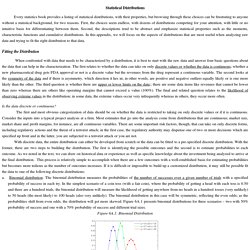
First, the choices seem endless, with dozens of distributions competing for your attention, with little or no intuitive basis for differentiating between them. Second, the descriptions tend to be abstract and emphasize statistical properties such as the moments, characteristic functions and cumulative distributions. In this appendix, we will focus on the aspects of distributions that are most useful when analyzing raw data and trying to fit the right distribution to that data. Fitting the Distribution When confronted with data that needs to be characterized by a distribution, it is best to start with the raw data and answer four basic questions about the data that can help in the characterization.
Is the data discrete or continuous? A. Figure 6A.1: Binomial Distribution b. C. D. E. Decision Tree for Choosing Tests.