background preloader

Datavisualisation

Facebook Twitter

22 free tools for data visualization and analysis. You may not think you've got much in common with an investigative journalist or an academic medical researcher. But if you're trying to extract useful information from an ever-increasing inflow of data, you'll likely find visualization useful -- whether it's to show patterns or trends with graphics instead of mountains of text, or to try to explain complex issues to a nontechnical audience. There are many tools around to help turn data into graphics, but they can carry hefty price tags.
The cost can make sense for professionals whose primary job is to find meaning in mountains of information, but you might not be able to justify such an expense if you or your users only need a graphics application from time to time, or if your budget for new tools is somewhat limited. If one of the higher-priced options is out of your reach, there are a surprising number of highly robust tools for data visualization and analysis that are available at no charge. Data cleaning DataWrangler. Tools. Data Wrangler. Data visualisation tools. SWF Charts > Introduction. XML/SWF Charts is a simple, yet powerful tool to create attractive charts and graphs from XML data. Create an XML source to describe a chart, then pass it to this tool's flash file to generate the chart.
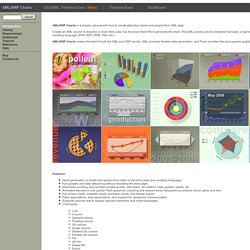
The XML source can be prepared manually, or generated dynamically using any scripting language (PHP, ASP, CFML, Perl, etc.) XML/SWF Charts makes the best of both the XML and SWF worlds. XML provides flexible data generation, and Flash provides the best graphic quality. Features: Quick generation of charts and graphs from static or dynamic data (any scripting language) Full updates and data streaming without reloading the web page. Testimonials I just wanted to pass along how well your script worked for our stock performance page. Good work! This is amazing software. Just want to thank you for this wonderful upgrade.

I purchased your product a couple days ago and first had time to sit down and work with it this morning. Wow, you are the best! Thanks for your great script. THIS ROCKS! Visualizing.org | Data Visualizations, Challenges, Community. Polymaps. Data visualisation. Visualization. Visualising data. Create Infographics online. Data journalism and data visualization | News. Periscopic: Do good with data.