
Untitled. Bar Graphs with Error Bars in Google Spreadsheet. 375.full. Food Preference in the Orange Elephant Snail, Tylomelania sp. “poso orange” This semester I took an Animal Behavior class at California State University, Sacramento.
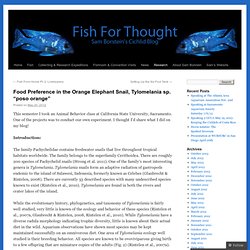
One of the projects was to conduct our own experiment. I thought I’d share what I did on my blog! Introduction: The family Pachychelidae contains freshwater snails that live throughout tropical habitats worldwide. The family belongs to the superfamily Cerithoidea. While the evolutionary history, phylogenetics, and taxonomy of Tylomelania is fairly well studied, very little is known of the ecology and behavior of these species (Rintelen et al., 2007a, Glaubrecht & Rintelen, 2008, Rintelen et al., 2010).
Figure 1: Adult Tylomelania sp. In this study, I tested whether or not Tylomelania sp. Figure 2: A new born baby Tylomelania sp. Materials and Methods: All of the Tylomelania sp. This study was conducted in the Evolutionary Ecology of Fishes Lab at California State University, Sacramento. Repashy gel foods were used in this study (Fig. 3). Data Analysis: Results: Discussion: Using Excel to do Basic Statistical Tests. Before you do statistical tests, it’s important to understand what they are.
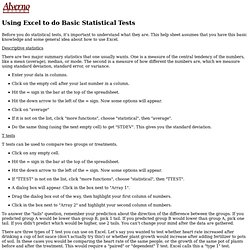
This help sheet assumes that you have this basic knowledge and some general idea about how to use Excel. Descriptive statistics There are two major summary statistics that one usually wants. One is a measure of the central tendency of the numbers, like a mean (average), median, or mode. The second is a measure of how different the numbers are, which we measure using standard deviation, standard error, or variance. Enter your data in columns.Click on the empty cell after your last number in a column.Hit the = sign in the bar at the top of the spreadsheet. T tests T tests can be used to compare two groups or treatments. Click on any empty cell. To answer the "tails" question, remember your prediction about the direction of the difference between the groups. There are three types of T test you can use on Excel. Abstract - Measuring Selectivity in Food Choice. Monarch Food Choice HS Experiment. Abstract - Design/analysis of multiple choice feeding preferences.
Abstract - Analysis of feeding preference experiments. Error bars in experimental biology. What are error bars for?
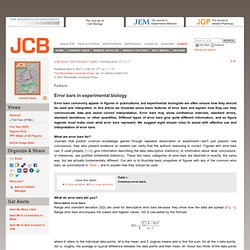
Journals that publish science—knowledge gained through repeated observation or experiment—don't just present new conclusions, they also present evidence so readers can verify that the authors' reasoning is correct. Figures with error bars can, if used properly (1–6), give information describing the data (descriptive statistics), or information about what conclusions, or inferences, are justified (inferential statistics). These two basic categories of error bars are depicted in exactly the same way, but are actually fundamentally different. Our aim is to illustrate basic properties of figures with any of the common error bars, as summarized in Table I, and to explain how they should be used.
Table I. Common error bars What do error bars tell you? Descriptive error bars. Range and standard deviation (SD) are used for descriptive error bars because they show how the data are spread (Fig. 1). Figure 1. Descriptive error bars. Online activity - Standard Deviation. Explanation At this level, we will look at three key aspects of the standard deviation:The standard deviation is useful as a distance measure, for example you can say that a value is 1 standard deviation above the mean;The standard deviation appears in many statistical measures;The standard deviation of a sample can be used to calculate the standard error of the sampling distribution of sampling means.Standard Deviation as a Measure of DistanceAs the standard deviation is a measure of distance from the mean, you can talk about any value in your data in terms of how many standard deviations from the mean it lies.
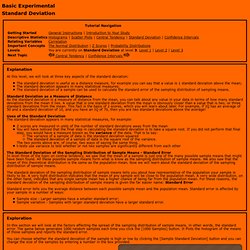
A value that is one standard deviation from the mean is obviously closer than a value that is two, or three standard deviations from the mean. This fact is the basis of z scores, which you will learn about later. For example, if IQ has an average of 50 and a standard deviation of 10, and you have an IQ of 70, then you are two standard deviations above the average! Selective slug grazing-meadow plants - Good! Infra-red time-lapse video of a slug in a food choice experiment. Abstract - Artificial medium for slug feeding choice. Slug Food Prefences - Article. Oecologia, Volume 125, Number 1. Abstract - lab evaluation of legume palatability to slug.