
Mark Liddell (@markliddell) Blprnt (blprnt) Sarah Williams (@datasew) Kristin Fontichiaro (@activelearning) Jer Thorp: Make data more human. Designers Make Data Much Easier to Digest. Edwebet 88 - Transforming learning with digital collections - Presentaciones de Google. Visualizing the world's Twitter data - Jer Thorp.
Jer Thorp: Make data more human. David McCandless. Snake Oil Supplements — Information is Beautiful. Regularly updated with revitalising boosts of fresh data.
New entries include melatonin, proving travellers were right about its effect on sleep; and good evidence for Vitamin D for flu, bones and long life. Evidence for valerian as a cure for anxiety has dropped, as has any likelihood that cranberry juice has impact on urinary infections. Thanks to visitor suggestions we’ve added entries for supplements that may in some cases be harmful, including Vitamin A, which has been linked to birth defects. Note: You might see multiple bubbles for certain supplements. These is because some supps affect a range of conditions, but the evidence quality varies from condition to condition. This visualisation generates itself from this Google Doc. World. Front Porch Math learn who we are and our mission. Truth Decay: An Initial Exploration of the Diminishing Role of Facts and Analysis in American Public Life.
Kristin Fontichiaro's Blog About Learning, Teaching, Making Things, and Libraries. Building professional capacityTeacher-librarians are well positioned to impart data literacy to teens, but who’s giving instructors the resources and support that they need to do so?
Kristin Fontichiaro, clinical associate professor at University of Michigan’s School of Information, and Jo Angela Oehrli, learning librarian at University of Michigan Library, were up for the task. Library2017 fakenews. Untitled. C21 Teaching - Home. Mark Liddell – Century 21 Teaching. How statistics can be misleading - Mark Liddell. Statistics can be used in a powerful and useful ways.
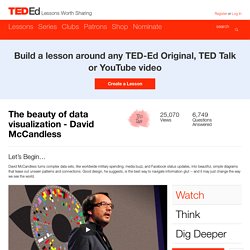
In what ways could this world data be analyzed in order to help society? Take a look at this site! Any ideas about this information could be used to improve the lives of people? Are there ways that we can analyze statistics visually? This site provides some helpful tools for analysis. There are many different ways that statistics can be analyzed. 100 People: A World Portrait. Blackboard Collaborate. Data Literacy is Essential to Modern Society. Why Kids Need Data Literacy, and How You Can Teach It. Welcome to City Digits. The beauty of data visualization - David McCandless.
To create his infographic about nutritional supplements, it took McCandless a month to review about 1,000 medical studies and design the visual.
Is that level of effort surprising, and do you think it’s worth it? Try out the interactive version that’s available on McCandless’s website. Infographics. Creating Data Literate Students. “[A] great resource!”
– 2017 conference attendee. How to spot a misleading graph - Lea Gaslowitz. Campaign 2018: Improving Cyber Literacy in Political Campaigns. Former Democratic National Committee interim chair and adjunct professor at Georgetown University A new paper by Donna Brazile, Joan Shorenstein Fellow (fall 2017) and former Democratic National Committee interim chair, examines whether political campaigns are up to the task of handling the threat of cyber attacks ahead of the 2018 midterm elections.
Brazile provides an overview of hacking that took place during the 2016 election, and what elected officials have done since then to address the issue. She also analyzes a Shorenstein Center survey of Republican and Democratic campaign operatives at the state and congressional levels, and finds that the respondents were not well prepared for cyber attacks. Less than half of those surveyed said they had taken steps to make their data secure and most were unsure if they wanted to spend any money on this protection.
Informacy and Metaliteracy: What Literacy looks like in the Age of Google. DQC Data Literacy Brief. Defining Data Literacy for K-12 Educators. These days, classroom teachers are asked to do more than ever before: teaching, observing, measuring, intervening, tailoring, personalizing, assessing and being assessed.
But do teachers have the information and support they need to succeed at this enormous challenge? The 7 Best Data Visualization Tools In 2017. Become Data Literate in 3 Simple Steps. Become Data Literate in 3 Simple Steps Just as literacy refers to “the ability to read for knowledge, write coherently and think critically about printed material” data-literacy is the ability to consume for knowledge, produce coherently and think critically about data.
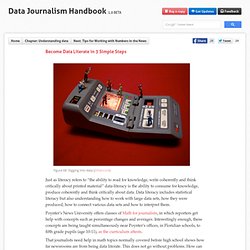
Data literacy includes statistical literacy but also understanding how to work with large data sets, how they were produced, how to connect various data sets and how to interpret them. Poynter’s News University offers classes of Math for journalists, in which reporters get help with concepts such as percentage changes and averages. Interestingly enough, these concepts are being taught simultaneously near Poynter’s offices, in Floridian schools, to fifth grade pupils (age 10-11), as the curriculum attests. That journalists need help in math topics normally covered before high school shows how far newsrooms are from being data literate. 1. What It Is And Why None of Us Have It. Data literacy in the real world. Webinar Discussions. Here, you’ll find links to the archived webinars referenced in Data Literacy in the Real World: Conversations and Case Studies. 1.
Thursday, July 14, 9:00am – 10:15am Eastern“But It’s a Number, So It Has To Be True!” : An Introduction to Data Literacy, Part I Presented by Lynette Hoelter, Interuniversity Consortium for Political and Social Research, University of Michigan, Ann Arbor, MI. Virtual Conference. “Thank you for the excellent virtual conference as well as all the extraordinary work you are doing.
I am looking forward to sharing your site with our faculty.” – 2018 participant Our three-year conference has come to a close. [click to download as PDF] Looking for sessions from the 2016 and 2017 conferences? You can find them here. Partners in the parent 4T Virtual Conference include: Livingston Educational Service Agency (LESA), Oakland Schools, and Washtenaw ISD. Kristin Fontichiaro. Truth Decay.