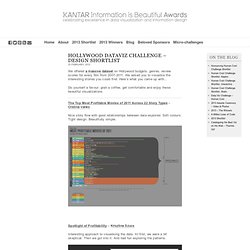

NounProject. DMA / REAS. Code.compartmental. Mathematical and Generative Graphics. Hollywood Visualisation Challenge - Design shortlist. We offered a massive dataset on Hollywood budgets, genres, review scores for every film from 2007-2011.

We asked you to visualise the interesting stories you could find. Here’s what you came up with… Do yourself a favour: grab a coffee, get comfortable and enjoy these beautiful visualizations. The Top Most Profitable Movies of 2011 Across 22 Story Types – Cristina Vanko Nice story flow with good relationships between data explored. Spotlight of Profitability – Krisztina Szucs Interesting approach to visualising the data. Navigating the Universe of Cinematic Opinion – Ben McCrea We had a few entries matching average audience score against critical scores. Hollywood Movies 2011 – Volodymyr Bondar Sometimes more is more. Hollywood Movie Studios by Numbers - Yoko Nakano and Steven Ziadie Oh these number are in a race! Hollywood Most Common and Profitable Plots – Francesco Villa Loved the colours and the groupings by story.
EN UNE SEULE IMAGE, les INFOGRAPHIES etpuisctout!: Archives. Ideas, issues, knowledge, data - visualized! Visualisation Magazine vol1. Film-Quality Stills Culled from Google Earth. AS-MAP : Complexity Cartographer, Semantic cartography : Creator of ISO-MAP : 3D Isometric Resume of a Business Commando. Visual Literacy: An E-Learning Tutorial on Visualization for Communication, Engineering and Business.
Graphic designers are ruining the web. What happens when you click on a weblink?

Here's one answer: a request goes from your computer to a server identified by the URL of the desired link. The server then locates the webpage in its files and sends it back to your browser, which then displays it on your screen. Simple. Well, the process was indeed like that once – a very long time ago. In the beginning, webpages were simple pages of text marked up with some tags that would enable a browser to display them correctly. This had several consequences. All of which was nice and dandy. You can see this for yourself by switching on the "view status" bar in your browser; this will tell you how many discrete items go into making up a page.
Whether you view this as a good thing or not depends on where you sit in the digital ecosystem. Personally, I'm a minimalist: I value content more highly than aesthetics. Think of it as the Library of Alexandria on steroids. Building on the API for the World Goverment Data Store. Governments around the globe are opening up their data vaults – allowing you to check out, visualise and analyse the numbers for yourself.

Just over a week ago the UK Government opened its data store to the public, an action The Guardian's Free Our Data campaign has long campaigned for. We felt there was a fascinating opportunity for us to build a missing link, which is a World Government Data Store where you can find statistics on a particular theme from data stores in any country that has opened up. By having datasets from all over the world in one centralised place, it is much easier for you to compare and contrast data.
Visual Literacy: An E-Learning Tutorial on Visualization for Communication, Engineering and Business. Collates the most creative and innovative visualisations of information. 6 Indispensable Free & Freemium SEO Tools. REAS.com / Casey Reas. 3D Soundclash - Immersive sound reactive application by @field_io #Processing. Code.compartmental. Programming Media I . Fall 2007.
Typositoire : Une typo et au lit. Graphic Design Inspiration and Photoshop Tutorials. Welcome to the Icon Deposit - Icon Deposit. Movie Trailers on Metacafe.com - Previews and extras from every major Hollywood release. 114:52 by CinemaSins (3/27/14) 1,231 views We've heard your cries, and finally decided to go back to the Twilight series, and now we remember why we stayed away for so long.

We found some sins... thought we'd share them. 213:09 by CinemaSins (3/14/14) 0 views You asked for it, and it was basically the biggest box office movie of 2013, so... here are all the sins in The Hunger Games: Catching Fire. Try to remember the books do not f*cking matter. Thank you, come again. 301:55 by CinemaSins (2/7/14) 10,169 views SPOILERS!
Chart Porn. Create and design your own graphs and charts online. 10 Awesome Free Tools To Make Infographics. Advertisement Who can resist a colourful, thoughtful venn diagram anyway?

In terms of blogging success, infographics are far more likely to be shared than your average blog post. This means more eyeballs on your important information, more people rallying for your cause, more backlinks and more visits to your blog. In short, a quality infographic done well could be what your blog needs right now. Designing An Infographic Some great tips for designing infographics: Keep it simple! Ideas for infographic formats include: Timelines;Flow charts;Annotated maps;Graphs;Venn diagrams;Size comparisons;Showing familiar objects or similar size or value.
Here are some great tutorials on infographic creation: Creating Your Infographic Plan and research.If required, use free software to create simple graphs and visualisations of data.Use vector graphic software to bring these visualisations into the one graphic. Create A Graph. Column Five // infographics. Truth in Mapping. Why the American Jewish Romance with Israel Is Coming to an End Business intelligence vs. infotainment. IllVILLE HOTEL. Am I Collective's Portfolio.