
PCA Step by Step!. It’s not a surprise to hear the phrase… Something important to have on mind is that if the covariance is 0, it doesn’t mean the variables are independent because they can have a non-linear relationship.

In the heatmap, we can appreciate how the darker colors represent variables that are strongly related between each other. For example, we can see how the price is strongly and directly related to #Rooms, #Bedrooms, and the BuildingArea. 3.Calculate Eigenvalues and Eigenvectors: If you aren’t familiar with these eigen-concepts, I would like to invite you to read my post: “Eigen-WHAT?” Visualizing K-Means algorithm with D3.js - TECH-NI Blog. The K-Means algorithm is a popular and simple clustering algorithm.
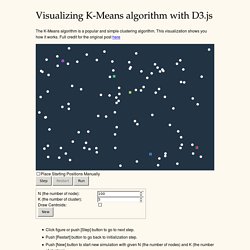
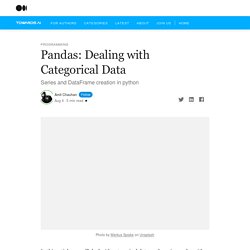
This visualization shows you how it works. Full credit for the original post here Click figure or push [Step] button to go to next step.Push [Restart] button to go back to initialization step.Push [New] button to start new simulation with given N (the number of nodes) and K (the number of clusters).Requires modern browsers (tested on IE 10, Firefox 25 and Chrome 30). You can find a detail description at k-means clustering - Wikipedia, the free encyclopedia, but it's too complecated to understand. Here is simpler steps: Pub.towardsai. Programming Series and DataFrame creation in python In this article, we will deal with categorical data analyses in pandas with python examples.
Your Step-by-Step Guide to Exploratory Data Analysis in Python. This article is going to be about the first look every data enthusiast has taken into their project's dataset.
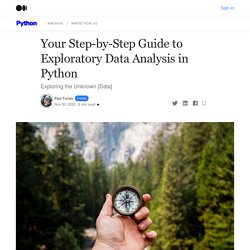
Before machine learning, before modeling, before feature selection — there has to be a fundamental understanding of the data you are using. That’s what we are doing — exploring. This article is about EDA, exploratory data analysis. We will take it through several steps of analysis and even introduce a few techniques that help us determine the best course of action. For this article, I am going to assume you understand the difference between continuous and categorical data and knowledge about the different packages Python has to offer. PI statistiques avec scipy. Cours python. Interpreting Correlation Coefficients - Statistics By Jim. Exploratory Data Analysis (EDA) — Don’t ask how, ask what. It is important to check outliers to understand if these are errors in the dataset.
This is a whole separate topic (See Natasha Sharma’s excellent article on the topic), but a very important one to understand whether or not to keep there are errors in the dataset. Simplifying the Dataset. 5 Outlier Detection Techniques that every “Data Enthusiast” Must Know. I already have a pretty detailed blog post on Geometric Models for Outlier Detection, where I primarily focus on Angle-Based Techniques(ABOD) and Depth-Based Techniques(Convex Hull).
You can check it out here. The below figure shows a pictorial view for both the techniques detecting outliers — Isolation Forest is a tree-based algorithm that tries to find out outliers based on the concept of decision boundaries(just like we have for decision trees). Descriptive Statistics in data science -with illustrations in ‘python’ A data scientist is a person who has mastered the art of learning from data to solve complex problems.
Statistics is a subject that helps the data scientist in mastering the art. Statistics can be considered to be a set of methodologies for collecting, representing, analyzing, and interpreting data. The basic role of statistics lies in turning data into useful information. The totality of data generated in the process of study or considered in a study is termed population. Characterizing the features of the population through a subset of the data (called a sample) is a crucial feature of statistics. Beginner’s Guide to NumPy for Data Science. In NumPy, arithmetic operations are done element-wise.

To achieve this, arrays should be of the same size/shape. To perform arithmetic operations on arrays of different sizes/shapes, broadcasting is used. Imagine that broadcasting means stretching the array to the required shape/size to perform arithmetic operations on it. Broadcasting Rules: Notebook Viewer. Python Numpy Tutorial - Complete Guide. NumPy, which stands for Numerical Python, is a library consisting of multidimensional array objects and a collection of routines for processing those arrays.
Using NumPy, mathematical and logical operations on arrays can be performed. NumPy is a Python package.
Comparison with SQL — pandas 1.2.4 documentation. Since many potential pandas users have some familiarity with SQL, this page is meant to provide some examples of how various SQL operations would be performed using pandas.
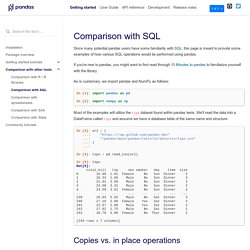
If you’re new to pandas, you might want to first read through 10 Minutes to pandas to familiarize yourself with the library. As is customary, we import pandas and NumPy as follows: In [1]: import pandas as pd In [2]: import numpy as np Most of the examples will utilize the tips dataset found within pandas tests. NumPy. Write Good Python Functions Using Type Dispatch.
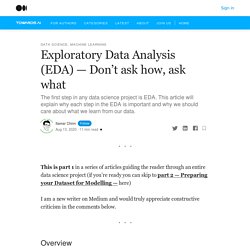
Introduction to Statistics in Python — Part 1. Peternjosh7365/crime-against-women - Jovian. Data Analysis with Python: Zero to Pandas - Course Project Guidelines (remove this cell before submission) Important links: This is the starter notebook for the course project for Data Analysis with Python: Zero to Pandas. Commencer la Data Science avec Anaconda et Jupyter Notebook. Top 7 Jupyter Notebook Extensions. Création de Series. Towardsdatascience. Data analysis is fundamentally about finding answers to questions with data. When we perform some calculation or compute a statistic for a set of data it is usually not enough to do that across the entire dataset. Instead we will usually want to split the data into groups, perform the computation and then compare the results across different groups. Data analysis is fundamentally about finding answers to questions with data. Let’s say we were a digital marketing team investigating the potential reasons behind a recent decline in conversion rate.
Looking at conversion rate as a whole over time would be unlikely to lead us to the possible cause. 14 Best+Free Data Science with Python Courses Online- [Bestseller 2021] So you have chosen Python programming for data science? Good Decision! Because Python is one of the most widely used programming languages in the data science field. Python has many packages and libraries that are specifically tailored for certain functions, including pandas, NumPy, scikit-learn, Matplotlib, and SciPy. 100+ Cheat Sheets: Data Science, Deep Learning And Machine Learning Cheat Sheet (Updated 2021 List) Today, We'll look after something very big that you might have never seen or rarely seen on the web. We have researched for more than 35 days to find out all the cheatsheets on machine learning, deep learning, data mining, neural networks, big data, artificial intelligence, python, Tensorflow, scikit-learn, etc from all over the web. To make it easy for all learners, We have zipped over 100+ machine learning cheat sheet, machine learning algorithms cheat sheet, tensorflow cheat sheet, neural network cheat sheet, deep learning cheat sheet, python data structures cheat sheet, r cheat sheet, sklearn cheat sheet, numpy cheat sheet pdf, keras cheat sheet, scipy cheat sheet, python data science cheat sheet, data science cheat sheet and more shared it in this post.
You can also download the pdf version of this cheat sheets (links are already provided below every images). How do you discover content from around the web related to AI, ML and Data Science? 👉 Imbalanced data in Machine Learning. Youtube.