
Interactive web-based data visualization with R, plotly, and shiny. Plot_ly() tooltips There are two main approaches to controlling the tooltip: hoverinfo and hovertemplate.
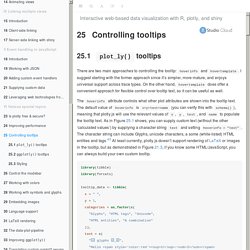
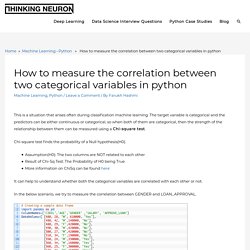
I suggest starting with the former approach since it’s simpler, more mature, and enjoys universal support across trace types. On the other hand, hovertemplate does offer a convenient approach for flexible control over tooltip text, so it can be useful as well. Markdown Tables generator - TablesGenerator.com. Aide à l'utilisation de python - Analyses de données et Dataviz - Un tuto simple pour l'analyse de données. How to measure the correlation between two categorical variables in python - Thinking Neuron. # Creating a sample data frame import pandas as pd ColumnNames=['CIBIL','AGE','GENDER' ,'SALARY', 'APPROVE_LOAN'] DataValues=[ [480, 28, 'M', 610000, 'Yes'], [480, 42, 'M',140000, 'No'], [480, 29, 'F',420000, 'No'],
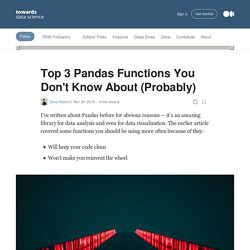
Modèle ARIMA avec Python - Prévisions de séries temporelles. Every Complex DataFrame Manipulation, Explained & Visualized Intuitively. Top 3 Pandas Functions You Don't Know About (Probably) This one was a big revelation to me.
Some time back I was handling some time-series data at work and had the problem where the first n observations were 0. For simplicity's sake, think of how you might have bought something but not consumed it for a period of time. The item is in your possession, but as you’re not using it, the consumption at the given date is 0. Descriptive Statistics with Pandas. When there are several distinct values it is often very helpful to see an estimate of where the data is located or centered.
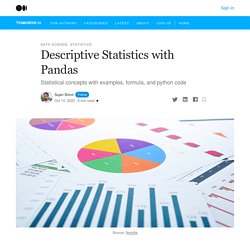
It is also referred to as Measure of Central Tendency. Let’s see different ways of measurement. Python - How do I read a large csv file with pandas? Be a more efficient data scientist, master pandas with this guide. Python is open source.
It’s great, but has the inherent problem of open source: many packages do (or try to do) the same thing. If you’re new to Python, it’s hard to know the best package for a specific task. You need someone who has experience to tell you. And I tell you today: there’s one package you absolutely need to learn for data science, and it’s called pandas. And what’s really interesting with pandas is that many other packages are hidden in it. 10 Simple hacks to speed up your Data Analysis in Python. Magic commands are a set of convenient functions in Jupyter Notebooks that are designed to solve some of the common problems in standard data analysis. You can see all available magics with the help of %lsmagic. Magic commands are of two kinds: line magics, which are prefixed by a single % character and operate on a single line of input, and cell magics, which are associated with the double %% prefix and operate on multiple lines of input.
Magic functions are callable without having to type the initial % if set to 1. Let’s look at some of them that might be useful in common data analysis tasks: % pastebin. A Complete Exploratory Data Analysis with Python. A complete Exploratory Data Analysis guide with Python | LinkedIn In this tutorial, we’ll explore the rental dataset, perform transformations, and reorganize the data as if we were actually preparing the data for modeling and creating models.

Visit Jupyter Notebook to see the concepts that will be covered about Exploratory Data Analysis. Note: important functions, outputs and terms are bold to facilitate understanding — at least mine. A Comprehensive Guide to Pandas for Data Science. Standard IndexingUsing iloc → Position based IndexingUsing loc → Label based Indexing Standard Indexing Selecting rows Selecting rows can be done by giving a slice of row index labels or a slice of row index position.
Did You Know Pandas Can Do So Much? Don’t Code Python Without Exploring Pandas First Pandas is one of the most widely-used Python libraries for data analysis and engineering.
This article will outline the key functionalities that Pandas library offers. St tutor2 python pandas. 7 Uncommon But Useful Pandas Functions. 7 Must-Know Data Wrangling Operations with Python Pandas. Textual data usually contains multiple pieces of information.
Just like we have done with dates, we may need to extract a piece of information from a text. The str accessor of Pandas provides numerous function to perform such operations efficiently. 3 Examples That Will Make You Like Python Pandas Even More. 6 Pandas Display Options You Should Memorise. As a Data Scientist, a Data Analyst or a Data Engineer, Pandas must be one of the most commonly used libraries in Python.

It can print the Data Frame in a pretty HTML styled format for us, which is one of its major features if you’re using Jupyter Notebook/Lab or Google Colab like me. Because Pandas use pre-defined HTML + CSS, we don’t need to worry about the format ourselves. However, sometimes we may want it to display in some format that other than its default one. Introduction to Pandas DataFrame.query() function. Pandas Pivot Table Explained - Practical Business Python. Introduction Most people likely have experience with pivot tables in Excel. Pandas provides a similar function called (appropriately enough) pivot_table . While it is exceedingly useful, I frequently find myself struggling to remember how to use the syntax to format the output for my needs.
This article will focus on explaining the pandas pivot_table function and how to use it for your data analysis. Selecting Subsets of Data in Pandas: Part 1. Pandas Tricks - Combine Data In Different Ways. Introduction If you have used pandas for your data analysis work, you may already get some idea on how powerful and flexible it is in terms of data processing. Many times there are more than one way to solve your problem, and choosing the best approach become another tough decision.
40 Examples to Master Pandas. A comprehensive practical guide. Pandas is one of the most widely-used data analysis and manipulation libraries. It provides numerous functions and methods to clean, process, manipulate, and analyze data. The best way to get comfortable working with Pandas is through practice. I previously wrote a practical guide that contains 30 examples.
In this article, I will enrich the examples to cover a broader scope together with the previous article. 40 examples in this article will include not only the basic functions and techniques but also some extreme cases. Most of the examples include the functions and methods that were not discussed in the previous article. Python Pandas: Tricks & Features You May Not Know. Pandas is a foundational library for analytics, data processing, and data science. It’s a huge project with tons of optionality and depth. This tutorial will cover some lesser-used but idiomatic Pandas capabilities that lend your code better readability, versatility, and speed, à la the Buzzfeed listicle. If you feel comfortable with the core concepts of Python’s Pandas library, hopefully you’ll find a trick or two in this article that you haven’t stumbled across previously. Aide-mémoire Pandas pour le Traitement de Données.
Merge, join, concatenate and compare — pandas 1.2.4 documentation.