
Data visualisation tools. 20+ Tools to Create Your Own Infographics. A picture is worth a thousand words – based on this, infographics would carry hundreds of thousands of words, yet if you let a reader choose between a full-length 1000-word article and an infographic that needs a few scroll-downs, they’d probably prefer absorbing information straight from the infographic. What’s not to like? Colored charts and illustrations deliver connections better than tables and figures and as users spend time looking back and forth the full infographic, they stay on the site longer. Angry / disappointed users.
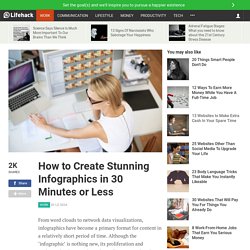
Voeg 'authentieke' teksten toe aan originele foto's. Letterjames is een gratis dienst waarmee je erg makkelijk gepersonaliseerde teksten kan toevoegen aan foto's of afbeeldingen uit hun archief (je kan niet je eigen foto's uploaden).
Het gaat om afbeeldingen waarop een bord, een affiche of iets dergelijks te zien is, waar jij je eigen tekst kan in plaatsen (vaak niet meer dan enkele zinnen of woorden). Letterjames doet erg denken aan gelijkaardige tools die ik in een eerder artikeltje kort heb besproken, zoals Redkid en ImageChef, maar het aantal aangeboden foto's is een heel stuk uitgebreider en ik vind ze ook mooier.
Infographics, Explained by LEGOs. LEGO bricks illustrate the simple idea behind infographics. Data: sorted, arranged, presented visually. Got it? Good. Now let's raid the toy box and play with the "data. " Image courtesy of Hot Butter Studio. The top 20 data visualisation tools. How to Create Stunning Infographics in 30 Minutes or Less.
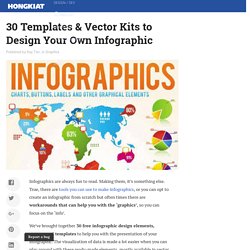
From word clouds to network data visualizations, infographics have become a primary format for content in a relatively short period of time.
Although the ‘infographic’ is nothing new, its proliferation and evolution has been nothing short of exponential in the past few years. Whether you love them or hate them, the rising popularity of infographics can’t be denied. If you want to get a message across, whether it is for your business, blog, or book club, using an infographic can be the best way to do it. If you’re incapable of drawing a recognizable human stick figure, let alone an entire data visualization, you may be agonizing over the disturbing fact that infographics are all the rage.
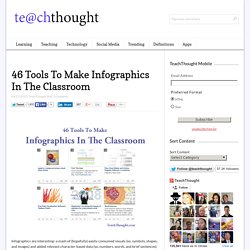
30 Templates & Vector Kits to Design Your Own Infographic. Infographics are always fun to read.
Making them, it’s something else. True, there are tools you can use to make infographics, or you can opt to create an infographic from scratch but often times there are workarounds that can help you with the ‘graphics’, so you can focus on the ‘info’. We’ve brought together 30 free infographic design elements, vectors and templates to help you with the presentation of your infographic. The visualization of data is made a lot easier when you can play around with these ready-made elements, mostly available in vector and Photoshop format. 10 Fun Tools To Easily Make Your Own Infographics. People love to learn by examining visual representations of data. That’s been proven time and time again by the popularity of both infographics and Pinterest. 46 Tools To Make Infographics In The Classroom. Infographics are interesting–a mash of (hopefully) easily-consumed visuals (so, symbols, shapes, and images) and added relevant character-based data (so, numbers, words, and brief sentences).
The learning application for them is clear, with many academic standards–including the Common Core standards–requiring teachers to use a variety of media forms, charts, and other data for both information reading as well as general fluency. It’s curious they haven’t really “caught on” in schools considering how well they bridge both the old-form textbook habit of cramming tons of information into a small space, while also neatly overlapping with the dynamic and digital world. How to Create an Awesome Infographic. 46Email Share.
Great Tips on How to Create Engaging Infographics for your Classroom. In his wonderful Book " Literacy in the New Media Age ", Gunther Kress talked about the shifting metrics of literacy and how digital media reshaped the focus of literacy.

For him, the image is now displacing the written code as the predominant mode of communication. The screen is replacing the book. When we look at our reading habits and our daily interaction with all this digital data that surrounds us day and night, it becomes clear that Kress point does make sense and that the traditional meaning of literacy is now being completely revolutionized with clear shift towards the visual. 5 Great Tools for Creating Your Own Educational Infographics.
Easily Remove Image Backgrounds Online - ClippingMagic. 8 Websites met gratis te gebruiken afbeeldingen. 10 Awesome Free Tools To Make Infographics. Advertisement Who can resist a colourful, thoughtful venn diagram anyway?

In terms of blogging success, infographics are far more likely to be shared than your average blog post. This means more eyeballs on your important information, more people rallying for your cause, more backlinks and more visits to your blog. In short, a quality infographic done well could be what your blog needs right now. Visual literacy K-8. Easily Make Your Own Unique (& Fake) CNN, NY Times, Etc. Website With “News Jack” With News Jack, all you have to do is paste the url address of any website and you’re immediately given the tools to easily transform its homepage into looking however you want it to look. Without having to register, you can make the New York Times highlight photos and articles of your great basketball-playing ability; have CNN focus on covering what was happening in 1776, or The Huffington Post reporting on the first Thanksgiving dinner.
Create A Graph. How To Design Your Own Infographics. Introduction Infographics seem to be a real trend today, with new ones popping up daily on all sorts of subjects.
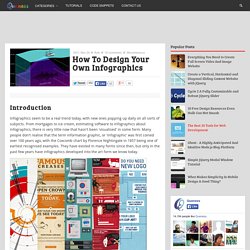
From mortgages to ice cream, estimating software to infographics about infographics, there is very little now that hasn't been 'visualised' in some form. Many people don't realise that the term information graphic, or 'infographic' was first coined over 100 years ago, with the Coxcomb chart by Florence Nightingale in 1857 being one of earliest recognised examples. They have existed in many forms since then, but only in the past few years have infographics developed into the art form we know today. However, they suit the information heavy world we live in as they give an easily understandable visual snapshot of something that may otherwise be plain text, and can help to widen the audience of a subject. Online Charting. Futures trading and various online stock trading.
Photovisi - Photo Collage Maker. 22 Useful Online Chart & Graph Generators. Have you ever encounter situations where you need to create a simple yet good-looking chart, graphs or diagrams and all you have is your browser?
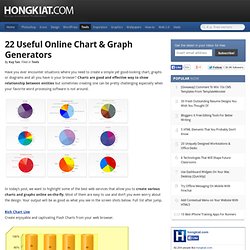
Charts are good and effective way to show relationship between entities but sometimes creating one can be pretty challenging especially when your favorite word processing software is not around. In today’s post, we want to highlight some of the best web services that allow you to create various charts and graphs online on-the-fly. Most of them are easy to use and don’t you even worry about the design.
Your output will be as good as what you see in the screen shots below. Full list after jump. Rich Chart LiveCreate enjoyable and captivating Flash Charts from your web browser. Pearltrees 2 sucks! Angry / disappointed users. Pearltrees v2 - Pealtrees Users feedback.