
Using social media monitoring tools starts with business connections. Photos du journal. Uld Twitter help urban planners improve transport networks? Philip Leifeld - Discourse Network Analyzer - Download - Download. Version 1.31 [October 7, 2013] Download DNA 1.31 now!
This new version has a new "agreement" option called "subtract". This option will add congruence ties to the network and subtract conflict ties from the network. The result is a signed, weighted graph with positive edge values indicating belief similarity and negative values indicating a tendency for belief conflict. Social media analytics startup Socialbakers raises $6M. As we saw this spring and summer, with the acquisition of Vitrue by Oracle , Buddy Media by Salesforce and Wildfire by Google , social media marketing is a hot space to be in.
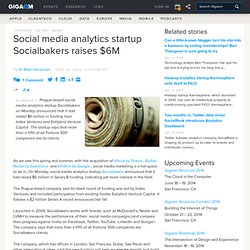
On Monday, social media analytics startup Socialbakers announced that it had raised $6 million in Series B funding, indicating yet more interest in the field. The Prague-based company said its latest round of funding was led by Index Ventures and included participation from existing funder Earlybird Venture Capital. It follows a $2 million Series A round announced last fall. Launched in 2009, Socialbakers works with brands, such as McDonald’s, Nestle and LVMH to measure the performance of their social media campaigns (and compare their progress against rivals) on Facebook, Twitter, YouTube, LinkedIn and Google+. A large-scale community structure analysis in Facebook.
Schizophrenia genetic networks identified; Connection to autism found. Although schizophrenia is highly genetic in origin, the genes involved in the disorder have been difficult to identify.
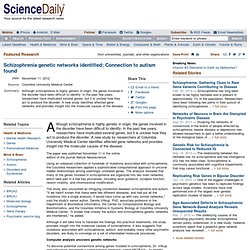
In the past few years, researchers have implicated several genes, but it is unclear how they act to produce the disorder. A new study by researchers at Columbia University Medical Center identifies affected gene networks and provides insight into the molecular causes of the disease. The paper was published November 11 in the online edition of the journal Nature Neuroscience. Using an unbiased collection of hundreds of mutations associated with schizophrenia, the Columbia researchers applied a sophisticated computational approach to uncover hidden relationships among seemingly unrelated genes. Science & Technology, [#SNA] The structure and dynamics of the global network of inter-firm R&D partnerships 1989–2002. By Michał Bojanowski, Rense Corten & Bastian Westbrock. View topic - Large Steam network visualization with Google Maps + Gephi. There is now a similar visualization about Player <-> Player friendship clusterization.
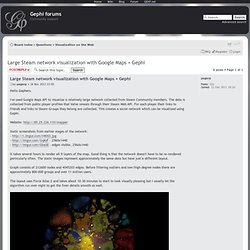
Graph in the first post is about Player <-> Groups bonds. Each circle is a player and is clustered near his friends. HCIL - Summer Social Webshop. Presentations (Images from Webshop 2012) Program Outline.

Home. Medallia Expands Social Media Text Analytics Platform to Include Sentiment Analysis. [1210.5268] Mapping the geographical diffusion of new words. Un graphe dynamique et interactif avec d3.js. Understanding Learning Analytics and Student Data. The Anatomy of a Search Engine. Sergey Brin and Lawrence Page {sergey, page}@cs.stanford.edu Computer Science Department, Stanford University, Stanford, CA 94305.
A Brief Introduction to Social Network Analysis by Orgnet, LLC. Social network analysis [SNA] is the mapping and measuring of relationships and flows between people, groups, organizations, computers, URLs, and other connected information/knowledge entities.
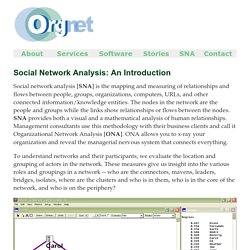
The nodes in the network are the people and groups while the links show relationships or flows between the nodes. SNA provides both a visual and a mathematical analysis of human relationships. Management consultants use this methodology with their business clients and call it Organizational Network Analysis [ONA]. ONA allows you to x-ray your organization and reveal the managerial nervous system that connects everything. To understand networks and their participants, we evaluate the location and grouping of actors in the network.
Deconstructing a Twitter spam attack. There has been a lot of discussion recently about the effect fake Twitter accounts have on brands trying to keep track of social media engagement.
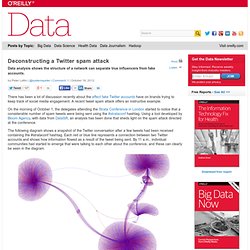
A recent tweet spam attack offers an instructive example. On the morning of October 1, the delegates attending the Strata Conference in London started to notice that a considerable number of spam tweets were being sent using the #strataconf hashtag. Using a tool developed by Bloom Agency, with data from DataSift, an analysis has been done that sheds light on the spam attack directed at the conference. The following diagram shows a snapshot of the Twitter conversation after a few tweets had been received containing the #strataconf hashtag. Max Planck Research Networks. How Learning Analytics Can Make Instructors More Effective in the Online Course. This is the first in a three-part series on learner analytics, cutting edge insight for the course instructor; how to assess student behaviours in an online course using the LMS data collection tools in order to provide more effective course design and instruction.

Most course instructors strive to create a class where students are engaged with the content, appear eager to learn and participate. The indicators of student engagement in a face-to-face class are straightforward enough, attendance, participation in class discussions, and/or visits to the instructor during his or her office hours. Measuring student engagement in an online course is more complex. GSoC: interconnect Gephi Graph Streaming API and GraphStream. My name is Min WU and during this Google Summer of Code I have worked on the project to interconnect Gephi Graph Streaming API and the GraphStream library.
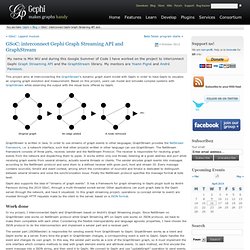
My mentors are Yoann Pigné and André Panisson. This project aims at interconnecting the GraphStream’s dynamic graph event model with Gephi in order to have Gephi to visualize an ongoing graph evolution and measurement. Based on this project, users can model and simulate complex systems with GraphStream while observing the output with the visual tools offered by Gephi. Visualize any Text as a Network - Textexture. The main principle behind Textexture is polysingularity. Polysingularity is the condition where multiple solutions are possible, but only some are actualised at every moment of time. This can be like this, but it can also be like that or like that, but in the end it's like this right now. Approaching text in a polysingular way allows us to read it in a non-linear way, while maintaining the narrative choices made by the author.
Карта Интернета. Finding Key Opinion Leaders & Influentials using Social Network Analysis. Professionals do not make decisions in isolation. In addition, they do not decide based on facts and numbers alone. Like the rest of us, they use their local network of trusted others for advice, opinions and expertise. The network map above reveals how physicians seek each other out to discuss new medical treatments.
Physician names have been replaced by numbers to protect their privacy. 2012 Aurora shootings. The “2012 Aurora shooting” article on Wikipedia is an example of a breaking news article which has a many editors intensively and jointly editing a single article. As of approximately 1pm EDT on July 21, 290 unique editors have made 1,281 changes to the article in a period of less than 36 hours. The chart below shows how the size of the article has rapidly grown as well as interesting changes in the concentration of work done per editor (Time is recorded at UTC). The blue dots are the length of the article in bytes. TEDxRiga - Valdis Krebs - Ending up on the Wrong Side of the Tracks. Trends in data analysis offer opportunities, challenges. [1206.7050] An Analysis of Interactions Within and Between Extreme Right Communities in Social Media. SWATD 2012 - Workshop on Social Web Analytics for Trend Detection - conference.researchbib.com.
Analytics Bellwether Teradata Champions the DATA Act: for Social Good, Economic Good. WASHINGTON, July 5, 2012 /PRNewswire/ -- On July 10 Teradata (NYSE: TDC) will showcase the positive rewards that integrated, detailed data visibility can bring to decision makers in government agencies and U.S. citizens through the DATA Act (H.R. 2146). How Connected Health, Public-Private Cooperation, And Big Data Can Revolutionize Health Care. The Big Data Playbook for Digital Agencies. Joseph Kelly is co-founder and CEO of Infochimps, the leading data marketplace and big data infrastructure provider helping agencies, enterprises and SMBs go from data to insights faster.
Science & Technology, [#SNA] A Short History of Correlation Networks Research. By Jenna Birch at FNA (via @kremplo) Networks and Collective Action by Ramon Flores, Maurice Koster, Ines Lindner, Elisenda Molina. Ramon Flores Universidad Carlos III de Madrid. Social Networks - Networks and collective action. Abstract. Informe Semanal: La mente social, Informe Semanal. Two Mapping Approaches for Change Networks.
Posted by Steve Waddell in Net Dev on January 26, 2011. Three Questions for Robin Dunbar. CROWN SOCIAL™ → Review of TrackingSocial Social Media Engagement Tool. Jakarta Votes: Can Social Media Analytics Offer More Insights than Pollsters? - Yahoo! Sports Singapore. Learning Alliances » Where is “the us” in the nework? Python Scripting Console for Gephi. What is enterprise social networking software? Google Sharpening Analytics' Tracking of Mobile Applications. IBM Offers Big Data Analysis Tool. No intro. New Framework for Social Media Analytics [Infographic]
Gvegayon / rgexf / wiki / es/Home. Mapping a Roundworm's Brain - Graphic. The New York Times - Breaking News, World News & Multimedia. Chimo/SocialAnalytics. Usage of Social Media in Italian Local Electoral Campaign. Delimiter – Big data and the end of theory? Big data and the end of theory? Amazon Products Visualization - YASIV. How to run NodeXL on a connected Mac (or other platform) using Amazon EC2.
“Trust Me”: Differences in expressed and perceived trust relations in an organization 10.1016/j.socnet.2012.01.004 : Social Networks. Networks of Networks: Changing Patterns in Country Bandwidth and Centrality in Global Information Infrastructure, 2002–2010 - Seo - 2012 - Journal of Communication. Detecting Overlapping Communities in Facebook with NodeXL. Overlapping Community Detection Algorithms. Dedicated to Social Media, Part II: InterContinental Hotels Group. Software: Visualization and Data Mining. Social Network Analysis, Link Analysis, and Visualization Software. Truth is a pathless land. -JK. Internet, Technology, Blogging, SEO, Social Media. Twitter Analytics Will Be Massive Boost to Brands Says Punch. Social Network Analysis of the Twitter conversations at the WEF in Davos. Facebook Social Graph. Social Media Management Systems and Strategy. CNN ECOSPHERE. MAS.961 Networks, Complexity and Its Applications, Spring 2011.
VOSviewer. Anderson Analytics - Data Mining & Text Analytics. [1112.3265] Predicting Links and Inferring Attributes using a Social-Attribute Network (SAN)