Www.who.int/whosis/whostat/EN_WHS10_Part2.pdf. Midwives: a worldwide commitment to women and the newborn. Midwife Attended Birth Statistics by Country - MotheringDotCommunity Community. Quote: Originally Posted by AlexisT Infant mortality is all deaths to one year.

Not the best statistic to use for this. Perinatal mortality covers deaths to 7 days; neonatal to 28 days. Also, in some countries, a team approach is used. I personally emailed people in each of the countries listed above (except for the U.S.) to gather the statistics I have above on midwife attended births and many explained how their systems worked. I would say that L&D nurses play an integral role the birth experiences of women in hospitals. Your point about IMR is well taken, but perinatal and neonatal rates are much harder to come by for a variety of countries. Nurses and midwives (per 1,000 people) Energy Intensity using Market Exchange Rates - Total Primary Energy Consumption - Total Energy - Energy Information Administration - Country Comparison, Country Comparison, Nations Statistics.
Hans Rosling's 200 Countries, 200 Years, 4 Minutes - The Joy of Stats - BBC Four. Bringing Infographics to Life. In a world that often finds itself awash in a sea of data, it's no surprise that readers can become entranced by tidy infographics.

While most can recognize effective representations of data, it takes both a critical and creative thinker to condense data into a compelling visual model. Even though infographics can help to clarify meaning, it takes a special teacher to bring data to life. In the exemplary presentation below, master teacher, Hans Rosling, condenses 200 years, and 120,000 pieces of data, into a compelling 4 minute history lesson.
Part infographic, part animation, and part passionate explanation, Rosling's presentation is a model for how data can be used to tell a complelling story. Tools for Creating InfographicsHow to Create Outstanding Modern InfographicsPeriodic Table of Visualization MethodsGoogle Public Data ExplorerLovely ChartsStatPlanetMany EyesHohliHave you ever led students to create infographics to demonstrate their understanding of a concept? Population Research Institute — Penn State University. Teachers College Press. MLA, APA, and Chicago/Turabian Bibliography Composer, Online Notecards.
Features - America's Children Key National Indicators of Well-Being, 2010. Bendheim-Thoman Center for Research on Child Wellbeing. Indicators of Child Well-Being. Resources For Welfare Decisions Indicators of Child Well-Being Background Indicators of child well-being increasingly are being used by federal, state and local governments and by nonprofit organizations to measure the impact of welfare reform and other social policies on children and their families.

Statistical indicators are useful in describing demographic and other characteristics, monitoring of program impacts, and holding agencies accountable for progress towards objectives and program outcomes. Child well-being indicators assess health status, cognitive functioning, and social and emotional status and encompass a wide range of variables including educational opportunity, economic security, food security, and family/neighborhood environments. Electronic Resources Annie E. Child Trends, Inc., Brett Brown, 202/362-5580. Children's Defense Fund, 202/662-3576 or cdfactioncouncil@childrensdefense.org.or Office of the Assistant Secretary for Planning and Evaluation, U.S. Annie E. Home - KIDS COUNT Data Center. Electric power consumption (kWh per capita) in Ecuador.
Administration for Children and Families Home Page. State Profile - Arizona. Demographic Information Population Statistics Poverty Rate Estimates Children Living in Working Families Median Income 2005 Estimated State Median Income for 4-Person Families: 2006 Estimated State Median Income for 4-Person Families: Source: U.S. Source: U.S. Early Care and Education Funding and Program Participation Head Start Head Start State Allocations: Number of Children Participating in Head Start: Source: U.S.
Child Care and Development Fund (CCDF) CCDF Expenditure: Federal Expenditure: State Expenditure: Average Monthly Number of Children Served: Average Monthly Number of Families Served: Source: U.S. Source: U.S. Note: This summary provides information obtained from the State CCDF ACF-696 reports submitted for the Fiscal Year (FY) 2005 CCDF expenditure year from all open appropriation years. Note: 1. State Energy Data System. The State Energy Data System (SEDS) is the source of the U.S. Energy Information Administration’s (EIA) comprehensive state energy statistics.
EIA’s goal in maintaining SEDS is to create historical time series of energy production, consumption, prices, and expenditures by state that are defined as consistently as possible over time and across sectors for analysis and forecasting purposes. Consumption by state and for the United States by energy source by sector in physical units and Btu annual time-series back to 1960 Prices & Expenditures by state and for the United States by energy source by sector prices in current dollars per million Btu and expenditures in current dollars annual time-series back to 1970 Production.
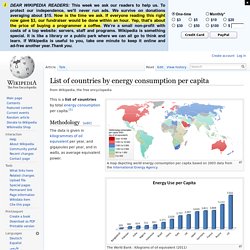
Electricity Consumption by County. Global Warming, Climate Change, Ecosystems, Sustainable Markets, Good Governance & the Environment. United Nations Department of Economic and Social Affairs. List of countries by energy consumption per capita. The World Bank : Kilograms of oil equivalent (2011) This is a list of countries by total energy consumption per capita.[1] Methodology[edit]