Prezi - Ideas matter. Great tools for data visualization. Most data is meaningless to most people — unless it is visualized.
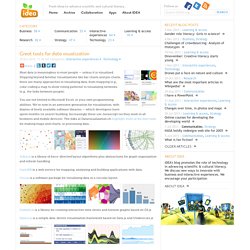
Stepping beyond familiar visualizations like bar charts and pie charts, there are many approaches to visualizing data, from mapping (e.g., color coding a map to show voting patterns) to visualizing networks (e.g., the links between people). You are not limited to Microsoft Excel, or your own programming abilities. We’re now in an awesome generation for visualization, with dozens of freely available software libraries — which developers have spent months (or years!) The Internet map. Data Visualizations, Challenges, Community.
Visual Thinking. 10 Awesome Free Tools To Make Infographics. Advertisement Who can resist a colourful, thoughtful venn diagram anyway?

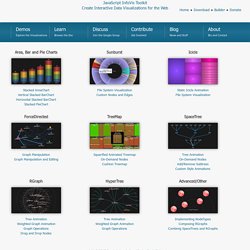
In terms of blogging success, infographics are far more likely to be shared than your average blog post. Human Emotions. Beautiful Weather Graphs and Maps - WeatherSpark. InfoVis Toolkit. JavaScript InfoVis Toolkit Create Interactive Data Visualizations for the Web Home ● Download ● Builder ● Donate Area, Bar and Pie Charts Sunburst.