background preloader

파이썬

Facebook Twitter

Simplicity, Flexibility, Beauty!, Kiwi PyCon 2011, August 27-28, 2011, Wellington, New Zealand. Python/Unix Course. Peter Shearer (x42260, pshearer@ucsd.edu) Website for class at We meet MWF from 10 to 10:50 in the IGPP Munk Lab Conference Room. There will be no final. Grades will be based on homework. To participate, you should install on a Mac:gfortran (64-bit version) (also see NetOps wiki) XCode: Macs Developer's environment. Click on the "Mac Dev Center". You will have to register with Apple to get this.... Macs are recommended. Homework (all are due at midnight on last day) UNIX (due Wed. Check out these keys to optimal tic-tac-toe strategy going first and going second. Notes and other material Class notes (PDF) 파이썬 리버싱 프로그래밍. Data Munging. SciPy - Learn Python - Free Interactive Python Tutorial.

Coding style - What is a clean, pythonic way to have multiple constructors in Python. Dive Into Python. Graphics with Matplotlib. Matplotlib is a large and sophisticated graphics package for Python written in object oriented style. 
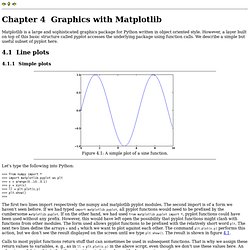
However, a layer built on top of this basic structure called pyplot accesses the underlying package using function calls. We describe a simple but useful subset of pyplot here. 4.1 Line plots 4.1.1 Simple plots Let’s type the following into Python: >>> from numpy import * >>> import matplotlib.pyplot as plt >>> x = arange(0.,10.,0.1) >>> y = sin(x) >>> ll = plt.plot(x,y) >>> plt.show() >>> The first two lines import respectively the numpy and matplotlib pyplot modules.

Calls to most pyplot functions return stuff that can sometimes be used in subsequent functions. Text such as a title, labels, and annotations can be added to the plot between the plt.plot and the plt.show commands. The resulting plot is shown in figure 4.2. 4.1.2 Multiple lines and points More complicated plots with multiple lines and line types can be made: The resulting plot is shown in figure 4.3. 4.2 Log plots and histograms. Python Tutorial. Python Tools.