
TFG ClimateChange Complete. ORISE: Bioenergy Workforce Development for Educators. Box Plot Analysis of Forest Growth in a Pellet Mill Region Subject: 9th Grade Algebra 1 Students will create and compare box plots for forest area data.

Data analysis will include five number summaries, range, interquartile range and outliers. Imaginary Marine Ecosystem Analysis 1. Climate Change: Vital Signs of the Planet: Engage: Changing Climate. If the evidence for global climate change is not understood or the potential impacts recognized, the challenges these present to the world cannot be addressed.
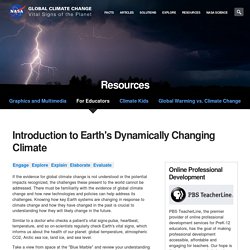
There must be familiarity with the evidence of global climate change and how new technologies and policies can help address its challenges. Knowing how key Earth systems are changing in response to climate change and how they have changed in the past is crucial to understanding how they will likely change in the future. Similar to a doctor who checks a patient's vital signs-pulse, heartbeat, temperature, and so on-scientists regularly check Earth's vital signs, which informs us about the health of our planet: global temperature, atmospheric CO2, Arctic sea ice, land ice, and sea level. Take a view from space at the "Blue Marble" and review your understanding of the Earth as a system.
ELI: Climate Change: Home. Climate Change is a technology-supported middle school science inquiry curriculum.

This curriculum focuses on essential climate literacy principles with an emphasis on weather and climate, Earth system energy balance, greenhouse gases, paleoclimatology, and how human activities influence climate change. Students use geospatial information technology tools (Google Earth), Web-based tools (including an interactive carbon calculator and geologic timeline), and inquiry-based lab activities to investigate important climate change topics. Grade 9 Archives - Green Learning. What is the future of Earth's climate? The High-Adventure Science Climate module has six activities.

Explore the question, what will Earth's climate be in the future? Through a series of guided questions, you will explore interactions between factors that affect Earth's climate. Explore temperature data from ice cores, sediments, and satellites and greenhouse gas data from atmospheric measurements, run experiments with computational models, and hear from a climate scientist working to answer the same question. You will not be able to answer the question at the end of the module, but you will be able to explain how scientists can be certain that Earth is warming while not being entirely certain about how much Earth will warm.
Earth Learning Solutions. Greenhouse Emissions Reduction Role-Play Exercise. This activity was selected for the On the Cutting Edge Reviewed Teaching Collection This activity has received positive reviews in a peer review process involving five review categories.

The five categories included in the process are. 3B: CO2 - My Life's Story. Part B: CO2—My Life's Story Atmospheric CO2 and temperature data taken from Vostok Ice Cores.

Image source: Bowman Global Change and The Birch Aquarium, Scripps Institute of Oceangography, UCSD The carbon cycle has changed over Earth's history Imagine if fossils didn't exist. Climate Change and Game-Based Learning. Teaching about complex interconnected systems like global climate change can be difficult.

There are many unseen pieces affecting the greater whole that young people (and many adults) might not understand. One approach to lifting this conceptual curtain for students is assigning the BrainPOP video on the topic prior to class, flipping the instruction. Try BrainPOP's Make-a-Map tool, which is an open-ended concept map, a playful assessment, to have students demonstrate interconnections. Making Climate Change Games. Climate Wizard. Global Warming Effects Map - Effects of Global Warming. The World's First Solar Road Is Producing More Energy Than Expected. By Katie Valentine Posted on Share this: "The World’s First Solar Road Is Producing More Energy Than Expected"

Renewable Energy. This Living Lab offers you a chance to evaluate the renewable energy sources in the U.S.

Renewable energy comes from natural resources such as wind, plant material, water (rain or tides), geothermal, or sunlight and is naturally replenished. Both renewable and non-renewable energy sources are used to generate electricity, power vehicles, and provide heating, cooling, and light. Renewable sources of energy vary widely in their cost-effectiveness and in their availability across the United States.
Although water, wind, and other renewables may seem free, the cost comes in collecting and transporting the energy to the places where energy is needed. Greenhouse gas benchmark reached. For the first time since we began tracking carbon dioxide in the global atmosphere, the monthly global average concentration of this greenhouse gas surpassed 400 parts per million in March 2015, according to NOAA’s latest results.
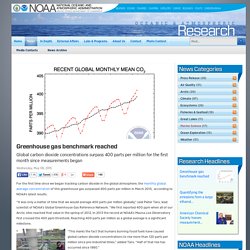
“It was only a matter of time that we would average 400 parts per million globally,” said Pieter Tans, lead scientist of NOAA’s Global Greenhouse Gas Reference Network. “We first reported 400 ppm when all of our Arctic sites reached that value in the spring of 2012. Story of Stuff. Causes of Climate Change. Key Points Both natural and human factors change Earth’s climate. Before humans, changes in climate resulted entirely from natural causes such as changes in Earth’s orbit, changes in solar activity, or volcanic eruptions. Extreme Ice Survey - Extreme Ice Survey. Earth Vision Institute, Founded by James Balog. Science. Download NASA's Eyes. Seize Your Power. Sea Ice Atlas. Ivanpah. How Were Fossil Fuels Formed?
Return to Challenges of Non-Renewable Energy This slideshow was produced by George Vibranz and Anne Glausser. Shale gas is a fossil fuel that formed millions of years ago. Different kinds of fossil fuels — coals, oils, and natural gases — formed as dead plants and animals decayed. Scientists refer to such remains as “organic matter.” The element carbon is the foundation for organic matter on Earth. Getting the Picture. The Big Energy Question. Interactive Map: Four Ways to Look at Carbon Footprints. About this graphic Graphics by Stephen Rountree and Adam Marr Source: World Resources Institute CAIT 2.0 climate data explorer Emissions data and national boundaries are from 2010.
For current emissions, per capita emissions, and intensity, the data are measured in tons of "carbon dioxide equivalent. " That is, they include carbon dioxide and five other greenhouse gases (methane, nitrous oxides, hydrofluorocarbons, perfluorocarbons, and sulfur hexafluoride) as measured by their global warming potential. Carbon Dioxide. U.S. Geological Survey: Climate and Land Use Change. Getting the Picture. Footprint Basics - Overview. Human activities consume resources and produce waste, and as our populations grow and global consumption increases, it is essential that we measure nature’s capacity to meet these demands.
The Ecological Footprint has emerged as one of the world’s leading measures of human demand on nature. Simply put, Ecological Footprint Accounting addresses whether the planet is large enough to keep up with the demands of humanity. The Footprint represents two sides of a balance sheet. Seize Your Power.