
What is Visual Rhetoric? Visual Rhetoric Overview, Definition, and Examples. Visual rhetoric, in a nutshell, refers to how we are persuaded by the things we see.
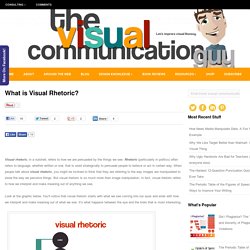
Rhetoric (particularly in politics) often refers to language, whether written or oral, that is used strategically to persuade people to believe or act in certain way. Knowledge management. Process of creating, sharing, using and managing the knowledge and information of an organization Knowledge management (KM) is the process of creating, sharing, using and managing the knowledge and information of an organization.[1] It refers to a multidisciplinary approach to achieve organisational objectives by making the best use of knowledge.[2] An established discipline since 1991[citation needed], KM includes courses taught in the fields of business administration, information systems, management, library, and information sciences.[3][4] Other fields may contribute to KM research, including information and media, computer science, public health and public policy.[5] Several universities offer dedicated master's degrees in knowledge management.
History[edit] In 1999, the term personal knowledge management was introduced; it refers to the management of knowledge at the individual level.[11] Research[edit] Dimensions[edit] The Knowledge Spiral as described by Nonaka & Takeuchi. Tutorial 4: Introducing RDFS & OWL. Next: Querying Semantic Data Having introduced the advantages of modeling vocabulary and semantics in data models, let's introduce the actual technology used to attribute RDF data models with semantics.
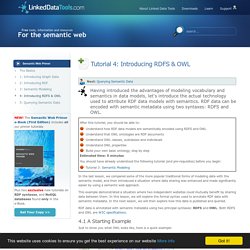
RDF data can be encoded with semantic metadata using two syntaxes: RDFS and OWL. After this tutorial, you should be able to: Understand how RDF data models are semantically encoded using RDFS and OWLUnderstand that OWL ontologies are RDF documentsUnderstand OWL classes, subclasses and individualsUnderstand OWL propertiesBuild your own basic ontology, step by stepEstimated time: 5 minutes.
What is an ontology and why we need it. Tutorial 1: Introducing Graph Data. Next: Introducing RDF The semantic web can seem unfamiliar and daunting territory at first.

If you're eager to understand what the semantic web is and how it works, you must first understand how it stores data. We start from the ground up by outlining the graph database - the data storage model used by the semantic web. After this tutorial, you should be able to: Describe in basic terms what the semantic web is.Experience the paradigm-shift of storing information as a graph database, rather than a hierarchical or relational database.Understand that the semantic web of data is defined using Resource Description Framework (RDF).Understand the basic principles of RDF statements and how they can define data graphs.
Spreadsheets Are Graphs Too! By Felienne Hermans, Assistant Professor, Delft University of Technology | August 26, 2015 Editor’s Note: Last May at GraphConnect Europe, Felienne Hermans – Assistant Professor at Delft University of Technology – gave this engaging talk on why you shouldn’t overlook the power of the humble spreadsheet.
Listen to or read her presentation below. Register for GraphConnect San Francisco to hear more speakers like Felienne present on the emerging world of graph database technologies. What is Pattern Analysis? PATN is a software package that performs Pattern Analysis.
PATN aims to try and display patterns in complex data. CLUSTER ANALYSIS METHOD OF RHETORICAL CRITICISM – The Visual Communication Guy: Designing, Writing, and Communication Tips for the Soul. Making Sense of the Data, Part 1. Infographics Are the Communication Paradigm of the Future. These days, infographics are becoming ubiquitous.
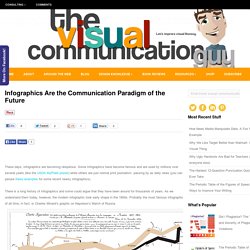
Some infographics have become famous and are used by millions over several years (like the USDA MyPlate poster) while others are just normal print journalism passing by as daily news (you can peruse these examples for some recent newsy infographics). There is a long history of infographics and some could argue that they have been around for thousands of years. As we understand them today, however, the modern infographic took early shape in the 1800s. The hidden legacy of Bertin and “The Semiology of Graphics” The Semiology of Graphics (SOG) is a kind mythical book.
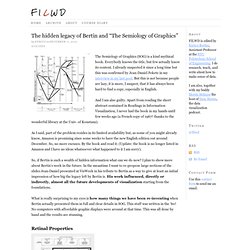
Everybody knows the title, but few actually know its content. I already suspected it since a long time but this was confirmed by Jean-Daniel Fekete in my interview in my last post. But this is not because people are lazy, it is more, I suspect, that it has always been hard to find a copy, especially in English. And I am also guilty. TO UNDERSTAND IS TO PERCEIVE PATTERNS.
Data Visualization for Human Perception. Gallery of Data Visualization - Bright Ideas. Remixing Rosling. The Church of London commissioned me to remix two of the famous Gapminder bubble graphics to illustrate an interview with Hans Rosling for Google's "Think Quarterly" Magazine.
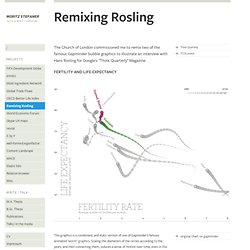
Fertility and life expectancy This graphics is a condensed, and static version of one of Gapminder's famous animated "worm" graphics. Scaling the diameters of the circles according to the years, and then connecting them, induces a sense of motion over time, even in this static image. It is fascinating to see how Vietnam is today on the same level as the US in 1980 with respect to the fertility rate and life expectancy. Also note how the dip in Botswana's curve reflects the drastic effects of AIDS in this country in the 1980s. Child mortality This chart dramatically shows how Bangladesh manages to reduce its child mortality with a rate faster than Sweden ever did. Full magazine. Moritz.stefaner.eu - /
Beliv06 - 23 May 2006 - Home Page. News [Jul'07] BELIV'08, a new edition of the workshop, will be hosted at ACM CHI 2008 in Florence, Italy on 5 Apr 2008.
Deadline for submission is 30 Oct 2007. For more info see the BELIV'08 workshop website. [May'07] Workshop report published in the ACM <inteactions> magazine: [Dec'06] A draft of the BELIV'06 workshop report is available online. [Nov'06] Workshop proceedings now available in the ACM Digital Library (paper titles below now link to their location in the ACM DL): Workshop description. Enrico Bertini. Enrico.bertini.me/material/biovis2011-hitsee.pdf. Enrico.bertini.me/material/infovis2011-qm-taxonomy.pdf. Enrico.bertini.me/material/eurovis2012-anim-sm.pdf. Enrico.bertini.me/material/tvcg2011-seven-scenarios.pdf.
Enrico.bertini.me/material/infovis2011-cloudlines.pdf. Fell in Love with Data — A podcast on data visualization with Enrico Bertini and Moritz Stefaner. This is onformative a studio for generative design. Pretty pictures: Can images stop data overload? 16 April 2012Last updated at 19:01 ET By Fiona Graham Technology of business reporter, BBC News.
Introducing the Knowledge Graph. The Work of Edward Tufte and Graphics Press. Graphics Press LLC P.O. Box 430 Cheshire, CT 06410 800 822-2454 Edward Tufte is a statistician and artist, and Professor Emeritus of Political Science, Statistics, and Computer Science at Yale University. He wrote, designed, and self-published 4 classic books on data visualization.
Perception and visualization - 02_perception-visualization_1up.pdf. What is Data Visualization? Designing Visualizations for Time-Based Data. A Tour Through the Visualization Zoo. Jeffrey Heer, Michael Bostock, and Vadim Ogievetsky Stanford University Introduction. Moments of innovation – data visualization. Data Visualization: Modern Approaches. About The Author. Expose Data. A Periodic Table of Visualization Methods. Infographics & Data Visualisation. Graphical visualization of text similarities in essays in a book. Relation Browser / Visualisations showing relations. Relation Browser - Moritz Stefaner Different types of relations, different type of entities. Emerging Information Architectures « Srinivas Reddy’s Weblog.