
Vintage Chart Shows Design Evolution of Everyday Objects Up To 1934 - Earthly Mission. Vintage Chart from 1884 Shows the Highest Buildings of the Old World - Earthly Mission. The Roads of Ancient Rome Visualized in the Style of Modern Subway Maps. Sasha Trubetskoy, an undergrad at U.
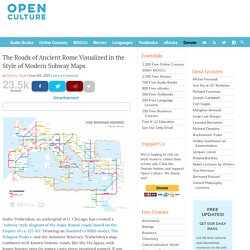
Chicago, has created a "subway-style diagram of the major Roman roads, based on the Empire of ca. 125 AD. " Drawing on Stanford’s ORBIS model, The Pelagios Project, and the Antonine Itinerary, Trubetskoy's map combines well-known historic roads, like the Via Appia, with lesser-known ones (in somes cases given imagined names). If you want to get a sense of scale, it would take, Trubetskoy tells us, "two months to walk on foot from Rome to Byzantium. If you had a horse, it would only take you a month. " You can view the map in a larger format here. Would you like to support the mission of Open Culture? Also consider following Open Culture on Facebook and Twitter and sharing intelligent media with your friends. Note: This map first appeared on our site back in 2017. Related Content:
Obesity System Influence Diagram. Let’s All Obsess Over This Intricate Map of Alt Music History. It started with the Sex Pistols.
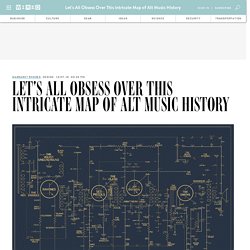
Specifically, with the Sex Pistols’ June 4, 1976, show at the Lesser Free Trade Hall in Manchester, England. Cosmigraphics: Picturing Space Through Time in 4,000 Years of Mapping the Universe. Long before Galileo pioneered the telescope, antagonizing the church and unleashing a “hummingbird effect” of innovation, humanity had been busy cataloging the heavens through millennia of imaginative speculative maps of the cosmos.
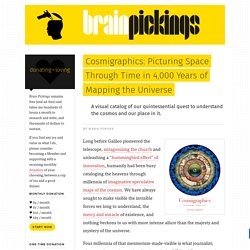
We have always sought to make visible the invisible forces we long to understand, the mercy and miracle of existence, and nothing beckons to us with more intense allure than the majesty and mystery of the universe. Four millennia of that mesmerism-made-visible is what journalist, photographer, and astrovisualization scholar Michael Benson explores with great dedication and discernment in Cosmigraphics: Picturing Space Through Time (public library) — a pictorial catalog of our quest to order the cosmos and grasp our place in it, a sensemaking process defined by what Benson aptly calls our “gradually dawning, forever incomplete situational awareness.” Amazingly Detailed Timeline of World History from 1881 - Earthly Mission. Amazon. A Guide To Dog-To-Dog Greetings - Earthly Mission. Vintage Map Shows Dog Breeds of the World in 1936 - Earthly Mission. Dog Breeds Ranked by Temperament - Earthly Mission. The below infographic ranks 114 dog breeds based on the American Temperament Test Society’s temperament test data since 1977.
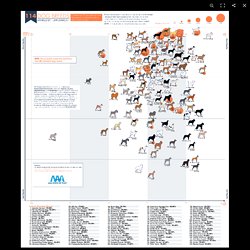
The temperament test measures ‘stability, shyness, aggressiveness, and friendliness as well as the dog’s instinct for protectiveness towards its handler and/or self-preservation in the face of a threat’ by simulating a walk through a neighborhood where daily life situations occur. The dog experiences visual (sudden sights like opening umbrellas), auditory (sounds like gunshots and hidden noises), and tactile (walking on different types of surfaces) stimuli. The exercise also tests their behavior toward friendly, neutral, and hostile strangers. A dog fails the test if it shows unprovoked aggression, panic without recovery, or intense fear and avoidance. Other dogs are not present during the test, so it does not take into account dog-on-dog aggression. Amazon. Informational wheels – Infographics for the People. Mid-century 3D data viz – Infographics for the People. This set of 675 hand-cut cards shows the demand for electricity between October 1951 and April 1954.
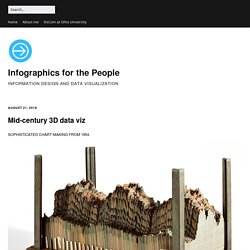
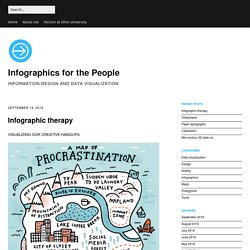
The cards are held by metal uprights on a wooden base, and were once enclosed in glass. Dimensions: 26.5 x 12 x 14 inches (67 x 31 x 36 cm). Each card plots demand in megawatts over the course of one day in 30-minute increments. Photographs: Museum of Science and Industry. This kind of load model is not unique. Infographic therapy – Infographics for the People. I’m a procrastinator, so this map by makes so much sense to me.
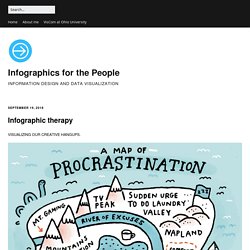
(Now, why don’t I finish this post tomorrow?) Below, the angst of being creative, by Christoph Niemann. Wendy MacNaughton’s working day. Infographics for the People – INFORMATION DESIGN AND DATA VISUALIZATION. A comparison of primary mirrors.
The Arecibo Reply was the name. Michæl Paukner. 40 Beautiful InfoGraphic Designs // WellMedicated. Best Paul Marcinkowski Kaplon Infographic Tattoo images on Designspiration. 40 Beautiful InfoGraphic Designs // WellMedicated. Gallery: How networks help us understand the world. Nonsense.
How Pop Chart Lab Made That Amazing Apple Infographic. Robby Stein remembers when Kevin Systrom was just another startup guy, who’d created a photo sharing app called Instagram.

They knew each other working at Google. Systrom’s idea for the thing was all around instant sharing—to capture fleeting moments, like a dog you met or going to the park. "People would comment, and then you’d have a conversation," recalls Stein. And yet a funny thing happened on Instagram’s march to 500 million users. The photo service that had been meant to be instant morphed into something less like a stack of polaroids and more like museum catalogue. They had seemed like such an obvious thing to add. The solution was Instagram Stories, a way of quickly sharing videos and pictures that disappear after 24 hours. Different Space Means Different Rules Instagram revolves around the story feed—a stream of images and captions that users scroll past.
What would happen if you were watching someone’s Story? Infographed.