
Creating Colorblind-Friendly Figures. Color is often used to display an extra dimension in plots of scientific data.
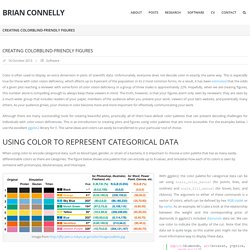
Unfortunately, everyone does not decode color in exactly the same way. This is especially true for those with color vision deficiency, which affects up to 8 percent of the population in its 2 most common forms. As a result, it has been estimated that the odds of a given plot reaching a reviewer with some form of color vision deficiency in a group of three males is approximately 22%. Hopefully, when we are creating figures, this number alone is compelling enough to always keep these viewers in mind. The truth, however, is that your figures aren‘t only seen by reviewers: they are seen by a much wider group that includes readers of your paper, members of the audience when you present your work, viewers of your lab‘s website, and potentially many others.
A protocol for data exploration to avoid common statistical problems - Zuur - 2009 - Methods in Ecology and Evolution. Summary 1.
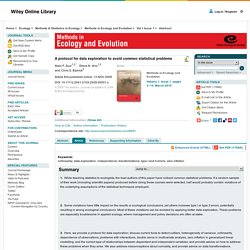
While teaching statistics to ecologists, the lead authors of this paper have noticed common statistical problems. Don’t introduce your paper by saying that many people have long been interested in the topic (UPATEDx2) Scientific papers often start by noting that lots of people are interested in the topic: “Topic X is of wide interest in ecology”, or some similar phrase.
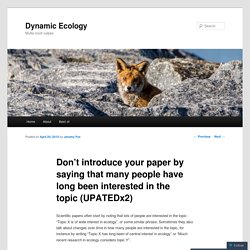
Sometimes they also talk about changes over time in how many people are interested in the topic, for instance by writing “Topic X has long been of central interest in ecology” or “Much recent research in ecology considers topic Y”. Please, please don’t do this.* As a colleague of mine likes to say, your paper should tell the reader about biology, not biologists. For instance, one line of research in my lab concerns spatial synchrony in population ecology. The difference here can be subtle. From my own experience, I can tell you that it’s hard to avoid slipping into talking about biologists rather than biology.
P.s. Ten Simple Rules for Writing a PLOS Ten Simple Rules Article. Citation: Dashnow H, Lonsdale A, Bourne PE (2014) Ten Simple Rules for Writing a PLOS Ten Simple Rules Article.
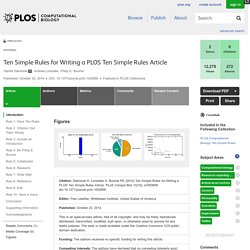
PLoS Comput Biol 10(10): e1003858. doi:10.1371/journal.pcbi.1003858 Editor: Fran Lewitter, Whitehead Institute, United States of America Published: October 23, 2014 This is an open-access article, free of all copyright, and may be freely reproduced, distributed, transmitted, modified, built upon, or otherwise used by anyone for any lawful purpose. The work is made available under the Creative Commons CC0 public domain dedication.
Funding: The authors received no specific funding for writing this article. Competing interests: The authors have declared that no competing interests exist. An investigation of the false discovery rate and the misinterpretation of p-values. How to format plots for publication using ggplot2 (with some help from Inkscape) The following is the code from a presentation made by Rosemary Hartman to the Davis R Users’ Group.
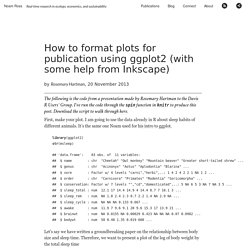
I’ve run the code through the spin function in knitr to produce this post. Download the script to walk through here. Buy a CrashPlan Subscription or Other Backup Solutions - CrashPlan. Paletton - The Color Scheme Designer. 10 Tips For Creating Good Looking Diagrams Using Inkscape. After multiple attempts to find a good free diagraming application I think I have found a decent solution.
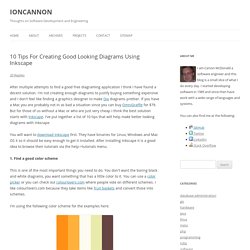
I'm not creating enough diagrams to justify buying something expensive and I don't feel like finding a graphics designer to make Dia diagrams prettier. If you have a Mac you are probably not in as bad a situation since you can buy OmniGraffle for $79. But for those of us without a Mac or who are just very cheap I think the best solution starts with Inkscape. I've put together a list of 10 tips that will help make better looking diagrams with Inkscape. You will want to download Inkscape first. 1. This is one of the most important things you need to do. I'm using the following color scheme for the examples here: 2. Don't be afraid to use the sides of the screen as a scratch pad. 3. Tutorial MalwareByte Anti-Malware Free. Malwarebyte est un anti-Malware très efficace qui permet de supprimer casi toutes les menaces informatiques incluants les les PUPs (programmes parasites).
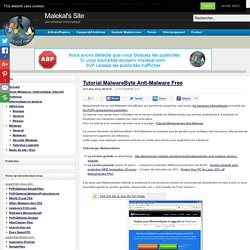
Ce tutorial vous guide dans l’utilisation de la version gratuite de Malwarebytes qui permet, gratuitement, d’analyser et éradiquer les malwares installés sur votre ordinateur. Pour un tutorial plus complet, reportez-vous à la page : Tutorial Malwarebytes Anti-Malware La version freeware de MalwareByte’s Anti-Malware ne possède pas de gardien pour protéger des intrusions, elle permet de scanner et supprimer les infections. Cette page vous explique comment scanner en mode sans échec pour supprimer les infections. Télécharger Malwarebytes : Il se peux que Malwarebytes détecte la présence d’une ancienne version et vous propose directement la mise à jour, si vous souhaitez garder la version gratuite, cliquez bien sur « Just Update my Free Version ».
L’installation ne donne pas de grande difficulté, elle ne sera pas détaillée.