
R graphics plot gallery - plots, charts and graphs with R code. R has great graphics and plotting capabilities and can produce a wide range of plots very easily.
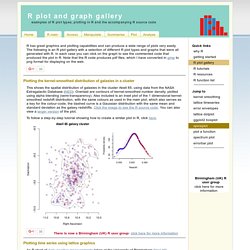
The following is an R plot gallery with a selection of different R plot types and graphs that were all generated with R. In each case you can click on the graph to see the commented code that produced the plot in R. Note that the R code produces pdf files, which I have converted in gimp to png format for displaying on the web.
This shows the spatial distribution of galaxies in the cluster Abell 85, using data from the NASA Extragalactic Database (NED). Overlaid are contours of kernel-smoothed number density, plotted using alpha blending (semi-transparency). To follow a step-by-step tutorial showing how to create a similar plot in R, click here. R graph Gallery. This page presents absolutely every graphic that is available on this website.

It can be very practical if you are browsing and looking for inspiration. For graphics ordered by type, see the Home page. If you are looking for something in particular, please use the search tool below. R Graph Catalog. Gallery. Gallery · mbostock/d3 Wiki. Wiki ▸ Gallery Welcome to the D3 gallery!

More examples are available for forking on Observable; see D3’s profile and the visualization collection. Please share your work on Observable, or tweet us a link! Visual Index Basic Charts Techniques, Interaction & Animation. Sigma js. Plotly Blog — Automatically Grab Data From an Image with... Imagine you find a cool graph on the web, and you’d like to see the source data.
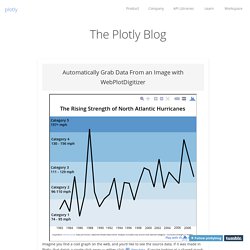
If it was made in Plotly, that data’s a single click away — either click if you’re looking at a shared graph, or the data grid icon if you’re looking at the graph in the plot editor. But source data for most other graphs won’t be that easy to access. Here at Plotly, we use an amazing tool called WebPlotDigitizer (WPD) to automatically grab data from a static image.
Let’s say, for example, you’re reading this wonderful Mother Jones article on the rising strength of hurricanes. Step 1, load the image: We saved the image locally (if it were an interactive graph or otherwise tricky to save, we would just take a screenshot), then launched WPD. Kartograph.org. Visualisation Tools and Resources. Drawing by numbers organises data visualisation tools under four categories - Charts and graphs; Mapping and mashups; Design, layout and presentation; and Data management tools.
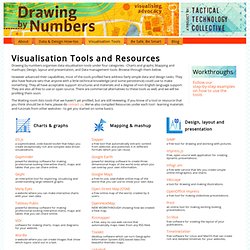
Browse through them below. However advanced their capabilities, most of the tools profiled here address fairly simple data and design tasks. Bl.ocksplorer.org - Learn d3.js by Example. ByteMuse.com - the code & musings of @ChrisPolis, Ruby on Rails web developer. JavascriptOO. MLDemos - A visualization tool for machine learning. 16 Online JavaScript Editors for Web Developers. 9 Minimal Frameworks for Front-End JavaScript Development. Imagine for a second the fact that, five years ago, we already had frameworks like jQuery to play with, and while not as functional and feature rich as today – it was already possible to configure and play with the web in hardly imaginable ways.

Today, there are literally hundreds of thousands of frameworks available to anyone who is brave enough to learn something new. Yes, most of them play very tiny role in the collective evolution of web development, but even that tiny contribution counts. Front-end is not just about HTML & CSS, it involves creativity just as much as it involves writing code in JavaScript, PHP, Python or any other programming language of your choice.
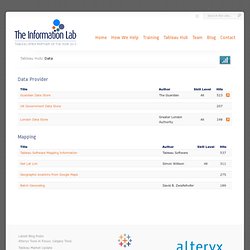
Have a look at my post on the top web programming languages in 2014 – if you’ve been following the trend, it will not be hard to see that most of those languages have held the top spot for over a decade. PHP: The Good Parts. Mr. Data Converter. Tableau Software. Examples by Freakalytics. Tableau Hub Data - The Information Lab. Tableau Hub / Data Data Posted by The Information Lab on Jan 1, 2012.
Data visualizations. The Lake Baikal is not so mysterious anymore, one riddle has been solved, how infrastructure for eco-tourism was created.
The Great Baikal Trail was created to develop system of environmental trails around Lake Baikal. The projects are based on work done by volunteers from all over the world; Russia, Australia, Germany, Spain, Italy, France, the Netherlands, United States, Canada, Mongolia, and many more places. To show the amount of work done in different areas of the lake I used: number of volunteers involved,man-days (=number of volunteers*number of projects' days). I encourage you to interact with my visualization and take part in the Baikal's projects. Treevis.net. API Reference. JavaScript API Tutorial. Show .js file Create the Viz As you build your web application, the first step is to create, or instantiate the view.
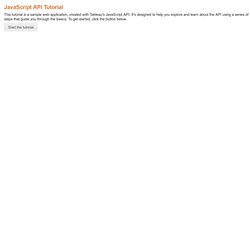
To do this, you create a new Viz object, passing the required parentElement (document.getElementByID) and url parameters, along with any options, such as hideTabs and hideToolbar. Here's the code: Getting started with the Java script API. Training & Tutorials. Health Intelligence. The Tableau Desktop Starter Kit data visualization (above) was designed by Lari McEdward, Dusting Smith and Ellie Fields from Tableau Software digital team.
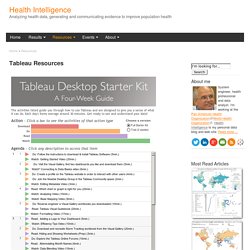
This viz was originaly featured in Tableau Public blog "20 Days to Tableau Success" Tableau Training and Tutorials - Online training and tutorial materials from Tableau. On-Demand Training section provides useful videos to improve Tableau use and skills. InterWorks Training Resource - A comprehensive collection of over 100 of the most requested links, blogs, tips and tricks the InterWorks team uses regularly, to help speed trainers in their way forward after a Tableau training course. Data Visualization with D3.js. Import bl.ocks.org to vida.io. The Directory of News Visualizations. Tableau Love. Tableau 8.1 and R. There are many reasons for this: The cost: While commercial distributions exist, open-source R is free. The rich features: R has an estimated user community of 2 million, which includes thousands of contributors from different domains expanding the language’s capabilities through new libraries.
The quality: R libraries are enhanced by domain experts and field-tested by the large user base including other experts with real datasets in real analysis scenarios. The learning resources: Thanks to the active user community, plenty of tutorials and sample code are readily available. Dream Team – combining Tableau and R. Last quarter was a bit too busy to write some new blog post because of a new job. And changing the job often come along with changing the tools you work with. That was my way to Tableau.
Tableau is one of the new stars in the BI/Analytics world and definitely worth a look. The people at Tableau describe their tool as an instrument that combines interactive visual analytics, sophisticated visualization methods, an easy to use graphical user-interface and a lot of connectors for dozens of different data sources ranging from standard Excel to more “Big Data” like things such as different Hadoop distributions and NoSQL databases. Tableau 8.1 and R. Data Visualization with Tableau. Wannabe Data Rock Star. Pubs.aeaweb.org/doi/pdfplus/10.1257/jep.28.1.209. RGraphExampleLibrary: R Example Graph Library. Introduction I wondered why there wasn't a website with output of the many examples of R packages.
Well, here it is. This site contains hundreds of plots and graphics from the example sections of over 90 packages. There are many more R packages available and even within the selected packages some plots are not created (for various reasons). But this collection should give a broad overview of the graphic features available. Using the library. Graphics in R. Please direct questions and comments about these pages, and the R-project in general, to Dr. Tom Philippi. Introduction. Find your palette. Librairies Javascript pour gérer les graphiques.
Browsing visualizations. MapStory : Welcome! La boite à outils. Gallery: U.S. Federal Budget. Back to Gallery Home Let’s begin with some tilted 3D pie charts and work our way toward a more revealing visualization. Here are the above 1993 and 2012 pie chart pairs, with Receipts and Outlays converted to flows in two separate Sankey diagrams: Extraction. The Dataviz Design Process: 7 Steps for Beginners. Does data visualization leave you feeling like this? If so, this beginner-level post is for you! Data visualization requires two skillsets: technical skills to create visualizations in a software program and critical thinking skills to match your visualization to your audience’s information needs, numeracy level, and comfort with data visualization.
If you’re interested in learning more about technical skills, check out my Excel for Evaluation chart tutorials and my Dataviz Challenges. Find your palette. A dynamic, browser-based visualization library. DataRemixed. VizWiz - Data Visualization Done Right. Visual Business Intelligence. We typically think of quantitative scales as linear, with equal quantities from one labeled value to the next. For example, a quantitative scale ranging from 0 to 1000 might be subdivided into equal intervals of 100 each. Bl.ocks.org - mbostock. D3.js crash course. d3.js - How to Use sql queries to draw dynamic chart in NV D3. D3.js: How to handle dynamic JSON Data. Explore - Data Visualization with D3.js.
Timeline JS. Load data from gist. GUESS: The Graph Exploration System. Data Visualization for the Web. Axiis : Data Visualization Framework. 45 Free or Super Cheap Tools for Creating Amazing Visual Content « Marketing Tools. Visualisation de données pour le web avec D3.js. Bio Pablo est ingénieur HES en informatique. Il travaille depuis 2007 au CERN, où il développe des applications web Java pour la gestion de projets et la planification des ressources. Quand il porte ses pantoufles, il lui arrive de créer des visualisations de données, de générer de l’art et de s’adonner aux joies de la programmation fonctionnelle.
Conférence sur le développement logiciel. General Update Pattern - Data Visualization with D3.js.