
Conditional independence. Combining Measurement Uncertainty. So, let’s assume that you are estimating measurement uncertainty.

You have identified the influencing factors, quantified the magnitude of their contribution, and reduced them to a standard uncertainty. Introduction to Statistics for Uncertainty Analysis. Introduction to Statistics Estimating uncertainty in measurement requires a good understanding of Statistics and statistical analysis.
While there are many free statistics resources online, no one has created a statistics guide specifically for the estimation of uncertainty in measurement. In this article, I have compiled a comprehensive list of the statistical functions to help you calculate uncertainty in measurement and evaluate your results. This guide will teach you the definition, equation, and instructions to calculate each statistical function. Plus, I have included some statistical principles and rules to help you evaluate your results. Background. Online Statistics Education: A Free Resource for Introductory Statistics. Developed by Rice University (Lead Developer), University of Houston Clear Lake, and Tufts University OnlineStatBook Project Home This work is in the public domain.
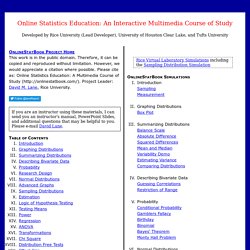
Therefore, it can be copied and reproduced without limitation. Bootstrapping (statistics) It may also be used for constructing hypothesis tests.
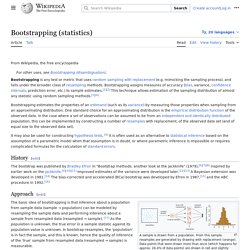
It is often used as an alternative to statistical inference based on the assumption of a parametric model when that assumption is in doubt, or where parametric inference is impossible or requires complicated formulas for the calculation of standard errors. The bootstrap was published by Bradley Efron in "Bootstrap methods: another look at the jackknife" (1979).[5][6][7] It was inspired by earlier work on the jackknife.[8][9][10] Improved estimates of the variance were developed later.[11][12] A Bayesian extension was developed in 1981.[13] The bias-corrected and accelerated (BCa) bootstrap was developed by Efron in 1987,[14] and the ABC procedure in 1992.[15] The basic idea of bootstrapping is that inference about a population from sample data (sample → population) can be modeled by resampling the sample data and performing inference on (resample → sample).
For regression problems, various other alternatives are available.[19] . Online Statistics Education: A Free Resource for Introductory Statistics. Data Perspective: Introduction to Logistic Regression with R. In my previous blog I have explained about linear regression.

In today’s post I will explain about logistic regression. Consider a scenario where we need to predict a medical condition of a patient (HBP) ,HAVE HIGH BP or NO HIGH BP, based on some observed symptoms – Age, weight, Issmoking, Systolic value, Diastolic value, RACE, etc.. In this scenario we have to build a model which takes the above mentioned symptoms as input values and HBP as response variable. Median. In a sample of data, or a finite population, there may be no member of the sample whose value is identical to the median (in the case of an even sample size); if there is such a member, there may be more than one so that the median may not uniquely identify a sample member.
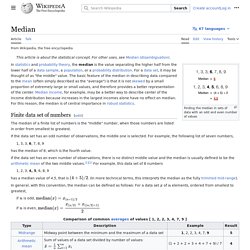
Nonetheless, the value of the median is uniquely determined with the usual definition. A related concept, in which the outcome is forced to correspond to a member of the sample, is the medoid. At most, half the population have values strictly less than the median, and, at most, half have values strictly greater than the median. If each group contains less than half the population, then some of the population is exactly equal to the median. Mean. For a broader coverage related to this topic, see average.
In mathematics, mean has several different definitions depending on the context. In probability and statistics, mean and expected value are used synonymously to refer to one measure of the central tendency either of a probability distribution or of the random variable characterized by that distribution.[1] In the case of a discrete probability distribution of a random variable X, the mean is equal to the sum over every possible value weighted by the probability of that value; that is, it is computed by taking the product of each possible value x of X and its probability P(x), and then adding all these products together, giving .[2] An analogous formula applies to the case of a continuous probability distribution. Not every probability distribution has a defined mean; see the Cauchy distribution for an example. Quantum Random Number Generator. Life can seem haphazard and chaotic, but true randomness is fundamentally mysterious, elusive, and remarkably difficult to observe.
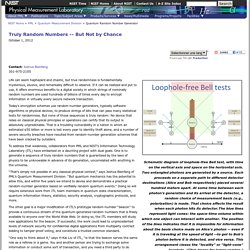
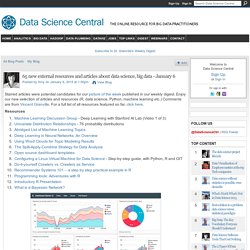
If it can be realized and put to use, it offers enormous benefits to a digital society in which strings of nominally random numbers are used hundreds of billions of times every day to encrypt information in virtually every secure network transaction. Today’s encryption schemes use random-number generators, typically software algorithms or physical devices, to produce strings of bits that can pass many statistical tests for randomness. Statistics A-B-C - Eurostat. List of Free Statistical Software. Data. Benford Online Bibliography. 100+ Interesting Data Sets for Statistics. Software for Data Mining, Analytics,Data Science, and Knowledge Discovery. Statistical Design Methods - Variability Analysis Tools. 65 new external resources and articles about data science, big data - January 6. Welcome toData Science Central Sign Upor Sign In Welcome toData Science Central.
Statistical Shortcomings in Standard Math Libraries (And How To Fix Them) By Evan Miller June 8, 2014 Summary: Basic statistical analysis requires special mathematical functions which almost no standard math libraries implement.
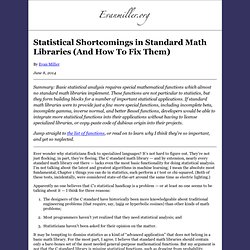
These functions are not particular to statistics, but they form building blocks for a number of important statistical applications. StatKey. StatKey to accompany Statistics: Unlocking the Power of Data by Lock, Lock, Lock, Lock, and Lock Help Presentation Mode StatKey v. 0.3.12 is written in JavaScript and should work well with any current browser including Chrome, Firefox, Safari, Opera, and IE.
Comments, feedback, and bug reports can be sent to lock5stat@gmail.com. Filtering the world's information. World Database of Happiness. Are you an Introvert or Extrovert? Statistics for Hackers. Statistics Explained. Meta-analysis. Introducing Probability. (This article was originally published at Learn and Teach Statistics and Operations Research, and syndicated at StatsBlogs.)
I have a guilty secret. I really love probability problems. R Statistical Software. Tutorial: How to detect spurious correlations, and how to find the real ones. Specifically designed in the context of big data in our research lab, the new and simple strong correlation synthetic metric proposed in this article should be used, whenever you want to check if there is a real association between two variables, especially in large-scale automated data science or machine learning projects. Quick-R: Home Page. Exporting the data and understanding the API. Bayesian statistics: a comprehensive course. This playlist provides a complete introduction to the field of Bayesian statistics. A geometric interpretation of the covariance matrix.
Introduction. R project. R Programming. The R Project for Statistical Computing. Statistics 110: Probability. The timeline of statistics. P-Values. 4.2 Model Selection Viewed As Search. Understanding the behavior of model selection tools is easiest when the model selection techniques are viewed as search techniques. The search space consists of possible subsets of predictor variables. The Birthday Simulation. Spurious Correlations. Statistics. Chaos, chance and money. December 2008. The law of near enough. No coincidence? Statistics and the outrageously unlikely.
Focusing on the specific makes us less likely to see true probability (Image: Valentine Vermeil/Picturetank) The Laws of the Improbability Principle. The Law of Selection. The Improbability Principle. ‘The Improbability Principle:Why Coincidences, Miracles, and Rare Events Happen Every Day’ by David J. Hand. Placebos without Deception: A Randomized Controlled Trial in Irritable Bowel Syndrome. Abstract Background Placebo treatment can significantly influence subjective symptoms. Fear as a form of control - Philosophy and Psychology. Hawthorne effect. Data Visualizations Designed to Mislead. Dossiers. Cybertherapy, placebos and the dodo effect: Why psychotherapies never get better - Cross-Check - Scientific American Blog Network. Researcher disputes claim that humans can distinguish one trillion odors: Number of odors people can smell still unknown, scientist says. The 10 Most Bizarre Correlations.
Infographics Lie. Here's How To Spot The B.S. How to Lie with Data Visualization. What’s Wrong with this Picture? The Art of Honest Visualizations. Lying with Data Visualizations: Is it Misleading to Truncate the Y-Axis? Gallery of Data Visualization - Context. 3 Ways to Detect Lying Data Visualizations. 5 Ways to Avoid Being Fooled By Statistics.
A Quick Guide to Spotting Graphics That Lie. Finding Examples of Misleading and Deceptive Graphs. A Good Example of Misleading Visualization. The Importance (and Allure) of Data Visualizations. ProTech Talent and Technology. Five Tips for Nonprofits Data Visualization. Not fit to print: When good design goes bad — AJ+ On the News. Type I and type II errors. Blondes really do have more fun: Men claim brunettes make the best wives, but fair haired women are better in bed. Which Character Strengths Are Most Predictive of Well-Being? - Beautiful Minds - Scientific American Blog Network. Heads or tails?