
California Science Framework. BAESI Maps Workshop. Hear the sounds of climate change—with earthquake monitors. The Pyrenees mountains, running along the French-Spanish border, conceal a labyrinthine underground laboratory.
Hear the sounds of climate change—with earthquake monitors. The Ocean Conveyor - Woods Hole Oceanographic Institution. A fundamental element of today’s climate system is a conveyor-like ocean circulation pattern that distributes vast quantities of heat and moisture around our planet.
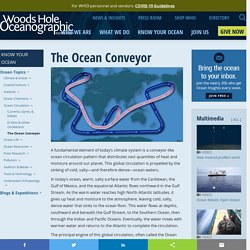
This global circulation is propelled by the sinking of cold, salty—and therefore dense—ocean waters. In today’s ocean, warm, salty surface water from the Caribbean, the Gulf of Mexico, and the equatorial Atlantic flows northward in the Gulf Stream. As the warm water reaches high North Atlantic latitudes, it gives up heat and moisture to the atmosphere, leaving cold, salty, dense water that sinks to the ocean floor. This water flows at depths, southward and beneath the Gulf Stream, to the Southern Ocean, then through the Indian and Pacific Oceans.
Sea Ice in Denmark Strait. Arctic sea ice is subject to some serious travel restrictions.
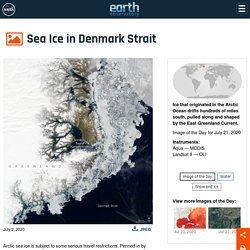
Penned in by major land masses, most ice that forms in the Arctic Ocean stays there for the duration of its existence—typically one to four years before melting. Some ice, however, escapes the Arctic Ocean through a handful of passages and then drifts south. That’s the origin of the sea ice pictured here. When satellites acquired these images in July 2020, the ice had drifted more than 1,000 kilometers (600 miles) from the Arctic Ocean.
The wide view above, acquired on July 2 with the Moderate Resolution Imaging Spectroradiometer (MODIS) on NASA’s Aqua satellite, shows sea ice hugging the coast of East Greenland. Teaching African American Literature During COVID-19. Global Warming Threatens World Water Supply. Why We Can't Stop Talking About California’s Sierra Snowpack. Clue into Climate. Climate Change is Changing When Plants Grow. Tracking Glacial Clues for Climate Change. Transportation’s Contribution to Climate Change. Climate Change and Human Health. Satellite Data Show Air Pollution Decreases over Southwest U.S. Cities. On March 19, California was one of the first states to set mandatory stay-at-home restrictions in an attempt to slow the spread of COVID-19.
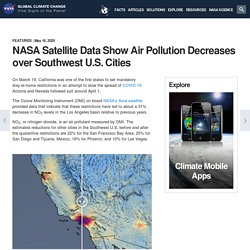
Arizona and Nevada followed suit around April 1. The Ozone Monitoring Instrument (OMI) on board NASA's Aura satellite provided data that indicate that these restrictions have led to about a 31% decrease in NO2 levels in the Los Angeles basin relative to previous years. NO2, or nitrogen dioxide, is an air pollutant measured by OMI. The estimated reductions for other cities in the Southwest U.S. before and after the quarantine restrictions are 22% for the San Francisco Bay Area; 25% for San Diego and Tijuana, Mexico; 16% for Phoenix; and 10% for Las Vegas. Nitrogen Dioxide (NO2) Decreases Over American Southwest. NASA: Climate Change and Global Warming. Climate Change MEL. The Climate Change MEL asks students to weigh the connections between evidence and alternative explanations about causes of climate change.
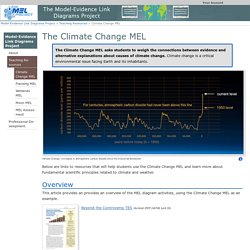
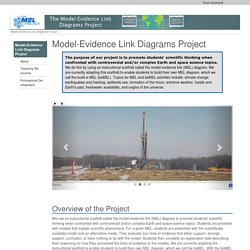
Climate change is a critical environmental issue facing Earth and its inhabitants. Climate Change: Increases in atmospheric carbon dioxide since the Industrial Revolution Provenance: Vostok ice core data/J.R. Petit et al.; NOAA Mauna Loa CO2 record Reuse: This item is in the public domain and maybe reused freely without restriction. Below are links to resources that will help students use the Climate Change MEL and learn more about fundamental scientific principles related to climate and weather. Overview. Model-Evidence Link Diagrams Project. The purpose of our project is to promote students' scientific thinking when confronted with controversial and/or complex Earth and space science topics.
California. Field Projects: Science in Action. Climate Impacts Graph Matching. Climate and Ice. Clouds, Precipitation, and Climate Change. Evaporation, Precipitation and Climate Change Rising global temperatures are likely to accelerate evaporation rates worldwide.
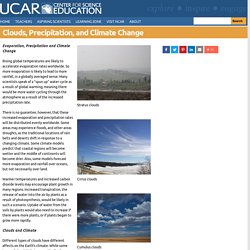
So more evaporation is likely to lead to more rainfall, in a globally averaged sense. Many scientists speak of a "spun up" water cycle as a result of global warming; meaning there would be more water cycling through the atmosphere as a result of the increased precipitation rate. There is no guarantee, however, that these increased evaporation and precipitation rates will be distributed evenly worldwide.
Some areas may experience floods, and other areas droughts, as the traditional locations of rain belts and deserts shift in response to a changing climate. Warmer temperatures and increased carbon dioxide levels may encourage plant growth in many regions. For some environmentalists, 'I can't breathe' is about more than police brutality. Those three words were uttered by Eric Garner in 2014 and again by George Floyd in 2020, when both men died while in police custody.
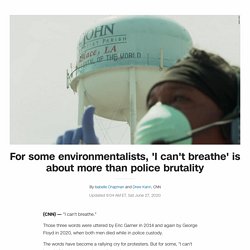
The words have become a rallying cry for protesters. But for some, "I can't breathe" is about more than police violence. "It's not just about being choked out by police brutality — it's about being choked out because of air pollution," said Heather McTeer Toney, a former regional administrator at the Environmental Protection Agency (EPA) under President Barack Obama and is now a national field director at Moms Clean Air Force, an advocacy group.
Listen to music made to the rhythm of global warming. One night in 2013, artist Stephan Crawford was sitting in his studio in San Francisco, thinking of a way of expressing Earth’s carbon cycle through a moving sculpture.
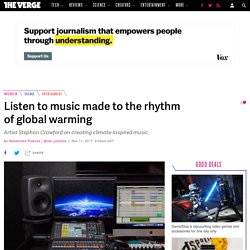
He had a metal rod in his hand, and he started tapping it against his workbench. In a new music video, Earth’s climate is baroque. Climate change is a pressing issue, but it can often feel distant and abstract.
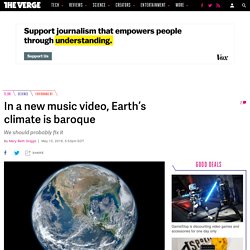
To make it resonate in people’s minds, one scientist turned dry data points into achingly beautiful music, making the frightening changes to our planet audible. In Nomine Terra Calens: In the name of a warming Earth. What’s Going On in This Picture? On-Demand Webinar: Teach With Graphs From The New York Times. Teaching students how to read, interpret and question graphs, maps and charts is a key 21st-century skill. In this 54-minute webinar, recorded live in March 2019, join educators from The Learning Network, the American Statistical Association and Desmos, as well as guest teachers and students, as we discuss ways to teach and learn with the award-winning graphics from The New York Times.
Today's atmospheric carbon dioxide levels greater than 23 million-year record. A common message in use to convey the seriousness of climate change to the public is: "Carbon dioxide levels are higher today than they have been for the past one million years! " This new study by Brian Schubert (University of Louisiana at Lafayette) and coauthors Ying Cui and A.
Hope Jahren used a novel method to conclude that today's carbon dioxide (CO2) levels are actually higher than they have been for the past 23 million years. The team used the fossilized remains of ancient plant tissues to produce a new record of atmospheric CO2 that spans 23 million years of uninterrupted Earth history. They have shown elsewhere that as plants grow, the relative amount of the two stable isotopes of carbon, carbon-12 and carbon-13 changes in response to the amount of CO2 in the atmosphere. Science Experiments for Kids.