
Bases de datos para la investigación y la docencia. Enquestes de les assignatures de Sociologia de tècniques quantitatives a la Facultat de Ciències Polítiques i de Sociologia de la UAB -Enquesta sobre Absentisme a la Facultat de Ciències Polítiques i de Sociologia.
Estudi realitzat a l'assignatura de Pràctiques Instrumentals III de la titulació de Sociologia durant el curs 2002-03. Absentisme.sav | Qüestionari absentisme.pdf -Enquesta sobre Ús del temps dels i de les joves universitaris. F.Tusell. Este curso dura un cuatrimestre, otorga 6 créditos, y aborda una selección de métodos de Análisis Multivariante.
Requiere una introducción al nivel de la asignatura Estadística para Economistas en esta Facultad. Programa y bibliografía Está disponible aquí el programa y bibliografía del curso actual . Data.world. Recipes by Category. 15 Easy Solutions To Your Data Frame Problems In R. R's data frames regularly create somewhat of a furor on public forums like Stack Overflow and Reddit. Starting R users often experience problems with the data frame in R and it doesn't always seem to be straightforward. But does it really need to be so? Well, not necessarily. With today's post, DataCamp wants to show you that data frames don't need to be hard: we offer you 15 easy, straightforward solutions to the most frequently occurring problems with data.frame. These issues have been selected from the most recent and sticky or upvoted Stack Overflow posts. Asdfree: european social survey (ess)
With more than a decade of microdata aimed at gauging the political mood across european nations, the european social survey (ess) allows scientists like you to examine socio-demographic shifts among broad groups all the way down to pirate party (piratpartiet) voters in sweden. with much of the same scope as the united states' general social survey (gss), this biennial survey gives demographers the clearest window into political opinion and behavior across the continent. run out of the city university london and six other centres, this survey sets its sample universe at all persons aged 15 and over resident within private households, regardless of nationality, citizenship, language or legal status in the participating countries. however, it's smart - dare i say very smart - to check the documentation report (here's round five) and confirm that the statistics you're coming up with actually generalize to the resident populations that you think that they do.
Statistical Computing. Spurious Correlations. LeaRning Path on R - Step by Step Guide to Learn Data Science on R. One of the common problems people face in learning R is lack of a structured path.
They don’t know, from where to start, how to proceed, which track to choose? Though, there is an overload of good free resources available on the Internet, this could be overwhelming as well as confusing at the same time. To create this R learning path, Analytics Vidhya and DataCamp sat together and selected a comprehensive set of resources to help you learn R from scratch. This learning path is a great introduction for anyone new to data science or R, and if you are a more experienced R user you will be updated on some of the latest advancements.
This will help you learn R quickly and efficiently. Step 0: Warming up Before starting your journey, the first question to answer is: Why use R? R is a fast growing open source contestant to commercial software packages like SAS, STATA and SPSS. Technological Progress - Our World In Data. Beamer theme gallery. Welcome to the beamer (latex) theme gallery.

Every time I wanted to pick a theme for a presentation I ended up spending a lot of time. That was because I didn't know the themes and for each one I had to recompile the whole presentation and see how it looked. I searched for samples of those themes but found none. That's why I did this. I hope it might be useful to somebody else. Navigate Notes The presentation used (© by Till Tantau) is under the GPL and you can get it here (and also in a lot of other places). Data Analysis Examples. The pages below contain examples (often hypothetical) illustrating the application of different statistical analysis techniques using different statistical packages.
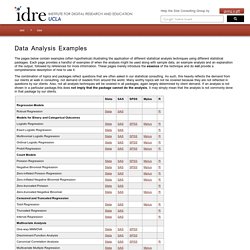
Each page provides a handful of examples of when the analysis might be used along with sample data, an example analysis and an explanation of the output, followed by references for more information. These pages merely introduce the essence of the technique and do not provide a comprehensive description of how to use it. The combination of topics and packages reflect questions that are often asked in our statistical consulting. As such, this heavily reflects the demand from our clients at walk in consulting, not demand of readers from around the world. ShinyEd.
Inglés Podcasts. System Dynamics courses at MIT. MathType Toolbar/Tab has disappeared from Microsoft Word. Issue: Occasionally the MathType Toolbar/Tab will disappear from the Microsoft Word Toolbar/Ribbon.
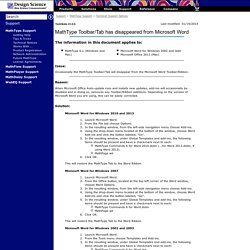
Reason: When Microsoft Office Auto-update runs and installs new updates, add-ins will occasionally be disabled and in doing so, removes any Toolbar/Ribbon additions. Depending on the version of Microsoft Word you are using, this can be easily corrected. Solution: Microsoft Word for Windows 2010 and 2013 Launch Microsoft Word.
This will restore the MathType Tab to the Word Ribbon. Microsoft Word for Windows 2007 Launch Microsoft Word. Microsoft Word for Windows 2002 and 2003.