
Information Is Beautiful. Waveform - bleep, techno and rave silkscreen prints. by Alex Szabo-Haslam. A series of beautiful, unique, silkscreen printed A2 posters visualising classic techno, bleep, and rave tracks.
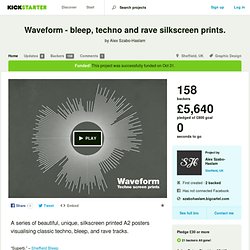
“Superb.” – Sheffield Bleep “Amazing.” – Mark Archer (Altern 8)“Really cool.” – Eraserhead"Unusual and poetic. " – Protein"Very cool. " – Darkfloor"Get involved. " – Hyponik My name is Alex, and I'd like your help to create a series of unique silkscreen printed posters. Each poster visualises soundwaves generated by some of my favourite bleep, techno and rave tracks. Using traditional, hand-pulled, silkscreen printing processes each waveform is lovingly crafted into a limited edition A2 print, signed and numbered by me.
The 12 prints. The paper. Each white waveform is printed onto a weighty stock: 270gsm Colorplan by GFSmith. Screen printing. Silkscreen printing is a traditional, versatile technique that uses mesh to create a stencil for artists to print their work onto almost any surface. Strictly limited edition. Only 25 of each will be produced in this series. Online. Infographic App & Presentation Tool. Create and share visual ideas online. Data Publica, your data services partner. [Boîte à outils] 5 applications pour créer sa propre infographie Esthétiques, claires, efficaces et surtout très virales, les infographies en tous genres envahissent la toile.
![[Boîte à outils] 5 applications pour créer sa propre infographie](http://cdn.pearltrees.com/s/pic/th/applications-infographie-43062586)
Très sollicitées pour mettre en avant les chiffres clefs d’une études, les principales tendances d’un marché, elles sont utilisées par un panel d’acteurs : agences, cabinet d’études, blogueurs, médias, etc. Surfant sur cette tendance, plusieurs startups ont mis au point des web applications permettant à n’importe quel internaute de créer tout seul une infographie en ligne, en y insérant ses propres données. Pour l’heure, une majorité de ces services (en anglais) sont encore en version bêta et donc perfectibles.
A moyen terme, ces plateformes pourraient néanmoins venir concurrencer les métiers de web designers ou tout au moins réinventer certaines collaborations. Tour d’horizon des 5 principaux outils actuellement disponibles. 1. Infogr.am. How to become a data visualization ninja with 3 free tools for non-programmers. We noticed many times between the lines of this blog how data visualization is in the hype and how this trend is growing and growing.
That’s good news guys! It’s fun and it’s … success! But as more and more people join this wild bunch we have to take care of those who are not as skilled as we are yet. There are many people out there who love data visualization but they think they are out of this business because they are not able to code. I personally think that this is a problem and that we have to be as inclusive as we can. Download Tableau Public. Raphaël—JavaScript Library. 33 Creative Infographics For Inspiration at DzineBlog. 15 Awesome Free JavaScript Charts. 75+ Tools for Visualizing your Data, CSS, Flash, jQuery, PHP. Most people would agree that the old adage “A picture is worth a thousand words” is also true for web based solutions.
There should be no discussion – Charts and Graphs are ideal to visualize data in order to quickly deliver an overview and communicate key messages. Whatever type of data presentation you prefer or suits you data (pie charts, bubble charts, bar graphs, network diagrams etc.), there are many different options but how do you get started and what is technologically possible?
In this article tripwire magazine present more than 75 Tools for Visualizing your data on a website and most of the options available will be covered. If you are aware of a tool, script etc. that deserves to be added to the list I would kindly ask you to leave a comment to everyone’s benefit. Advertisement Introduction Images says more than a thousands words. 50+ Free Resources for Charts and Graphs Solution. A chart or a graph is a visual representation of data, in which “the data are represented by symbols, such as bars, lines, or slices”.
These symbols can represent tabular numeric data, functions or some kinds of qualitative structures. For one reason or another, a lot of freelancers use Charts and Graphs to display the meaningful data visualizations. As a full-time freelancer and part-time geek, I really like to display my data analytics on pie charts and graphs too. Nowadays, there are over hundred thousands of resources available on the web. Instead of spending time on researching for the ones you needed, we pick the top and intelligent ones for you. Charts And Graphs: Modern Solutions - Smashing Coding. Advertisement Charts are supposed to visualize data in order to give a more profound understanding of the nature of a given problem or recent developments. Whatever type of data presentation you prefer (pie charts, bubble charts, bar graphs, network diagrams etc.), you can create charts in graphic editors manually or use special desktop-software instead.
In both cases you have a major problem: once you’d like to update an old chart, or create a new one, you have to run the application and create new images over and over again. That’s not flexible. That’s also not usable — e.g. if you’d like to update your chart live. 6 excellent charting libraries for php. Charts are an indispensable part of any data visualization work.
People can grok visual representation of data easily than a textual variety. Today there are a huge number of free chart libraries available to display visualizations on websites. Below is a small list of some of the libraries available for displaying charts using php. 1. Visifire output format: Silverlight license: GPL 3.0 / Commercial Visifire is a set of open source data visualization components – powered by Microsofts Silverlight technology. Features: Visually Stunning Animated ChartsSingle API to both Silverlight & WPFEmbed into Desktop or Web Applications in minutesReal time Charts / Live UpdateTiny footprintEnterprise grade featuresMicrosoft Expression Blend compatibleDual License – Open Source & Commercial 2.
Online Charts Builder. Interactive charts online! Online Chart Generator. Flash graph editor/viewer component. Visual editor. Create A Graph. SWF Charts > Introduction. AmCharts: Flash and JavaScript charts, stock charting software. KISSmetrics Web Analytics - Event Tracking, A/B Testing and Conversion Funnel Software.