
Better World Flux. Diagram software. yUML. PieColor. CSS Chart Generator. Below you can enter all the necessary information for your chart.
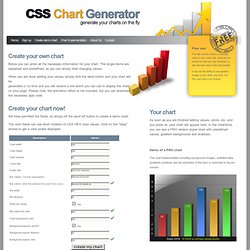
The single items are explained and predefined, so you can simply start changing values. When you are done adding your values, simply click the send button and your chart will be generated in no time and you will receive a link which you can use to display the chart on your page. Please note, the animation effect is not included, but you can download the necessary ajax code. The free version shows a copyright notice in the x-axis title, while the pro version is free from any backlinks or ads and has much more functionality. It has not the ability to use gradient images or any other cool stuff. We have pre-filled the fields, so simply hit the send off button to create a demo chart. The color fields can use short notation of CSS HEX color values. As soon as you are finished adding values, colors, etc, and you press ok, your chart will appear here. Demo of a PRO chart. Google Chart Gadget. Create A Graph.
ChartTool. Barchart. ChartGizmo. Public Data Explorer. Many Eyes. StatSilk. Gliffy. MakeSweet. “Intersection” The Intersection design is a Venn diagram with two overlapping circles - you control what is in the circles and (just as importantly) what lies between.
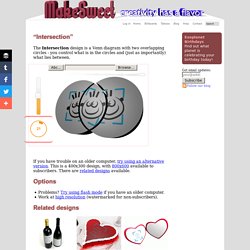
If you have trouble on an older computer, try using an alternative version. This is a 400x300 design, with 800x600 available to subscribers. There are related designs available. Options Problems? Related designs About this design This design is by paulfitz. Online Charts Builder. Hohli Online Charts Builder New version: Try new version of Charts Builder, it based on new Google Charts API Load From Image URL: Chart Data can't equal to original, but very similar to it.

Only for images on chart.apis.google.com Chart Type: 3D Pie charts Lines Bar charts Pie charts. GunnMap 2. Visual.ly. Create Polls Using Google Docs. Google Docs can be used for conducting surveys and polls.
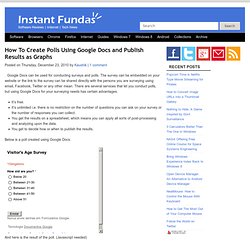
The survey can be embedded on your website or the link to the survey can be shared directly with the persons you are surveying using email, Facebook, Twitter or any other mean. There are several services that let you conduct polls, but using Google Docs for your surveying needs has certain advantages. It’s free. It’s unlimited i.e. there is no restriction on the number of questions you can ask on your survey or the number of responses you can collect. You get the results on a spreadsheet, which means you can apply all sorts of post-processing and analyzing upon the data. Below is a poll created using Google Docs. And here is the result of the poll. Above 51 This tutorial will show you how to create similar polls for your own blog or website.
How to Create a Poll or Survey Using Google Docs Open Google Docs and create a new Form. Save the poll by clicking on the Save button on the top-right. How to Publish Results. Chartle.net - interactive charts online!