
50 Great Examples of Data Visualization. Wrapping your brain around data online can be challenging, especially when dealing with huge volumes of information.

And trying to find related content can also be difficult, depending on what data you’re looking for. But data visualizations can make all of that much easier, allowing you to see the concepts that you’re learning about in a more interesting, and often more useful manner. Below are 50 of the best data visualizations and tools for creating your own visualizations out there, covering everything from Digg activity to network connectivity to what’s currently happening on Twitter. Music, Movies and Other Media Narratives 2.0 visualizes music. Liveplasma is a music and movie visualization app that aims to help you discover other musicians or movies you might enjoy.
Tuneglue is another music visualization service. MusicMap is similar to TuneGlue in its interface, but seems slightly more intuitive. Digg, Twitter, Delicious, and Flickr Internet Visualizations. Over 100 Incredible Infographic Tools and Resources (Categorized) This post is #6 in DailyTekk’s famous Top 100 series which explores the best startups, gadgets, apps, websites and services in a given category.

Total items listed: 112. Time to compile: 8+ hours. Follow @DailyTekk on Twitter to make sure you don’t miss a week! Update: Be sure to check out our latest post on infographics: Infographics Are Everywhere – Here’s How to Make Yours Go Viral. I love a good infographic! There’s more to this article! Hans Rosling: Hans Rosling nos muestra las mejores estadísticas que hayamos visto. David McCandless: La belleza de la visualización de datos. Composite: Adams' Synchronological Chart. Information Is Beautiful.
Data Visualizations, Challenges, Community. Introduction to Circos, Features and Uses // CIRCOS Circular Genome Data Visualization. INFO VISUALIZATION. Over 100 Incredible Infographic Tools and Resources (Categorized) A visual exploration on mapping complex networks.
Tabletop Whale. Why We Hate Infographics (And Why You Should) Those 2 guys invented the spreadsheet with Visicalc.
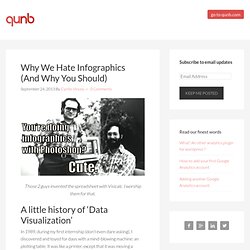
I worship them for that. In 1989, during my first internship (don’t even dare asking), I discovered and toyed for days with a mind-blowing machine: an plotting table. It was like a printer, except that it was moving a dozen of color pencils over the paper, and it was meant to draw… graphs, as it was called in the 80′s. Then in the early 90′s, hipsters of that time decided that graphs weren’t cool enough, and called them charts. On an unrelated note, charts started being printed on regular printers, and boredom killed millions of interns. Then in the mid-00′s, the art of plotting/graphing/charting data was re-named… data visualization. So here it is: ‘data visualization’ is the new cool name for ‘chart’. But in the early 10′s, infographics emerged, and the man in the street started getting confused: “Well, he said, is infographics the new new new name for charts“? #4. “‘Sup? One guy means ‘not many’, while 10 guys means “many many” . #3.