
Data Visualization Process. Data Vis Handout Convergence. About Data Visualization - Introduction to Data Visualization.
Chart Type Chooser. Google Sheets. Tableau Public. Make charts and dashboards online. Raw. Voyant Tools. Google Fusion Tables. Datavisualization.ch Selected Tools. Data Vis NC State Libraries. Data Visualization Support The library provides assistance with using GIS and online mapping software to visualize spatial data.
We can also help you create more effective charts, graphs, and other data visualizations. Contact us for more information and assistance. Data Visualization Guides Infographic Creation Guide. Data Visualization Tools Datavisualization.ch provides a useful compilation of free data visualization tools. Data Sources for Visualization Visualization Spaces The library provides spaces and technologies for high-resolution, immersive, and interactive displays of research data. Hunt Library Video Walls There are four large video walls built into the public spaces around the Hunt Library.
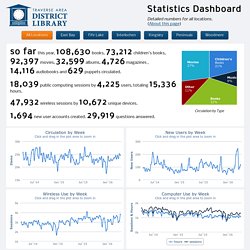
Coffee & Viz Code+Art Student Visualization Contest. Visualising Data Resources. Extreme Presentation. Teachthought. DataVision: Part I—Examples of Interactive Data Visualization Related to Health and Wellbeing. #dataviz - Recherche sur Twitter. Traverse Area District Library. Collection Distribution our collection contains 158,955 books, 77,798 children's books, 21,670 movies, 36,609 albums, 11,590 magazines, 9,799 audiobooks, and 22,333 other things in total. we've added 3,632 books, 1,677 children's books, 1,103 movies, 533 albums, 1,941 magazines, 259 audiobooks, 230 other things, and withdrawn 6,178 books, 1,246 children's books, 317 movies, 447 albums, 1,367 magazines, 125 audiobooks, 179 other things so far this year.
16 amazing book charts and visualizations. In this post you’ll find highly creative book visualizations, presenting books in a surprisingly new light.
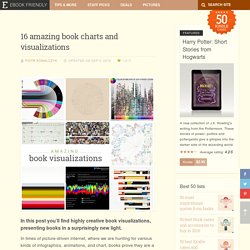
In times of picture-driven internet, where we are hunting for various kinds of infographics, animations, and chart, books prove they are a highly inspiring topic for visual design. Many of these visualizations are possible thanks to the internet and digitization. As soon as the book goes digital, its entire content can be analysed like never before. Creators can include much more data in the analysis, what leads to breath-taking visuals. Let’s just take a tool every internet user can utilize: Google Ngram Viewer. Processing the information is important, but nothing will replace the talent of a designer to present the data in a clear and exciting way. You’ll see below the greatest examples of data visualization applied to books, but not only that.
Please share in the comments the projects that should be highlighted. 16 amazing book charts and visualizations 1. . ⇢ Credits and more info. 10 Inspiring Examples of Data Visualization. Data can communicate powerful information—but only if you can actually understand what the data is telling you.
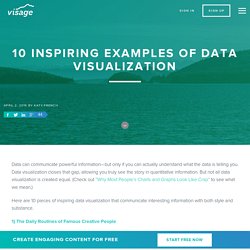
Data visualization closes that gap, allowing you truly see the story in quantitative information. But not all data visualization is created equal. (Check out “Why Most People’s Charts and Graphs Look Like Crap” to see what we mean.) Here are 10 pieces of inspiring data visualization that communicate interesting information with both style and substance. 1) The Daily Routines of Famous Creative People This interactive data visualization is a simple concept executed fantastically. Using information from the book Daily Rituals by Mason Currey, the site showcases the daily schedules of famous creatives broken down by time and activity. 2) The Year in News The best data visualizations communicate information and do so in an intuitive and beautiful way.
Advocacy, Legislation & Issues. Thank you for participating in School Library Snapshot!
Now more than ever, school librarians are critical to student success and it is equally critical that we showcase that value. The Library Snapshot is a project that originated with the New Jersey Library Association and New Jersey State Library in 2009. It was developed for public libraries and has been used across the country. We gratefully acknowledge these two organizations for their fantastic tool that we have adapted for use by school librarians. This personalized infographic will help you demonstrate the many ways that you support learning in your school. Get Started We recommend completing the Snapshot over a weeklong period. Once you have the data collected, the Snapshot form will take less than 5 minutes to complete.
Instructions for Completing the Snapshot.