
StoryCards For Your Agile Projects. WagBee: Incoming. SDK. The Thinkmap SDK enables organizations to incorporate data-driven visualization technology into their enterprise Web applications.
Thinkmap applications allow users to make sense of complex information in ways that traditional interfaces are incapable of. Thinkmap visualization software facilitates communication, learning, and discovery. 25 Web Designs with Modular Content Block Layouts. The grid based content block layout has become popular for many types of website, especially portfolios and inspiration ‘pinning’ sites.

These sites have a series of tiling blocks that fill the page, often in a kind of modular format where they rearrange themselves depending on the viewport size. This post rounds up a collection of 25 cool website designs that all feature a modular style content block layout. Strut - Beta. SPAAZE. Selected Tools. Edistorm. Enigma.io. DebateGraph. Pricing Plans, Online Whiteboard. Barley: The inline editor for everyone. Change the web. Iomap - Mohiomap. Install. Vensim. WebspirationPRO: Online Visual Thinking Tool. Graphviz - Graph Visualization Software.
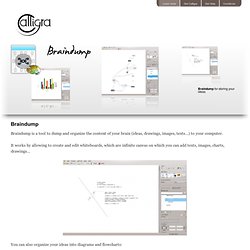
Pintask. The new liquid browsing for your desktop. Braindump. Braindump is a tool to dump and organize the content of your brain (ideas, drawings, images, texts…) to your computer.
Download NodeBox. The 36 best tools for data visualization. It's often said that data is the new world currency, and the web is the exchange bureau through which it's traded.
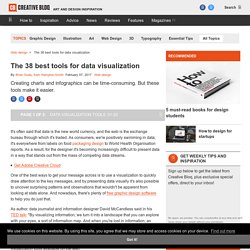
As consumers, we're positively swimming in data; it's everywhere from labels on food packaging design to World Health Organisation reports. As a result, for the designer it's becoming increasingly difficult to present data in a way that stands out from the mass of competing data streams. Get Adobe Creative Cloud One of the best ways to get your message across is to use a visualization to quickly draw attention to the key messages, and by presenting data visually it's also possible to uncover surprising patterns and observations that wouldn't be apparent from looking at stats alone. Iomap - A Visual Memory for Evernote - Pale Moon.
Jquery on Keeeb. Fetchnotes. Popplet. Nrk9kpt6m8. Exobrain. Create huge 3D Mind Maps and Concept Maps with InfoRapid KnowledgeBase Builder (Freeware) Untitled Prezi. PopBoardz. Trello. Mural.ly - Google Docs for Visual People. Tagxedo. Triptico. View topic - Scapple Beta - New Users Please Read. EDIT: Scapple is now available for purchase.

Please visit the product page: 15 Effective Tools for Visual Knowledge Management. Since I started my quest a few years ago searching for the ultimate knowledge management tool, I’ve discovered a number of interesting applications that help people efficiently organize information.
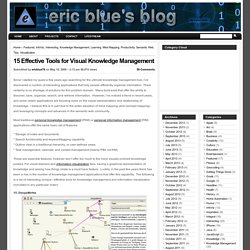
There certainly is no shortage of solutions for this problem domain. Many tools exist that offer the ability to discover, save, organize, search, and retrieve information. However, I’ve noticed a trend in recent years, and some newer applications are focusing more on the visual representation and relationship of knowledge. I believe this is in part due to the wider adoption of mind mapping (and concept mapping), and leveraging concepts and advances in the semantic web community. Most traditional personal knowledge management (PKM) or personal information management (PIM) applications offer the same basic set of features: These are essential features, however don’t offer too much to the more visually-inclined knowledge junkies. 15.
Link: Platforms: Win, Mac, Linux Cost: Free (Open Source) 14. Edit Nodes: Preview. The SpicyNodes chefs are hard at work creating the next generation of interactive data experiences using SpicyNodes on the iPad.

SpicyNodes excels for browsing big, related data. Imagine what it could do for your rich content about related ideas, people, apps, music, arts, sciences, business concepts, and so on. Visualizing Tables and Tabular Data with Circos. Circos can be used to turn tables into images.
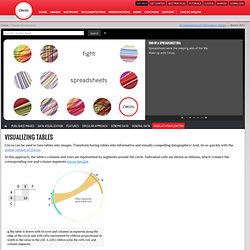
Transform boring tables into informative and visually compelling datagraphics! And, do so quickly with the online version of Circos. In this approach, the table's columns and rows are represented by segments around the circle. Individual cells are shown as ribbons, which connect the corresponding row and column segments (more details). ▴ The table is drawn with its rows and columns as segments along the edge of the circle and with cells represented by ribbons proportional in width to the value in the cell. Online Mind Mapping and Brainstorming app - SpiderScribe. List of concept- and mind-mapping software.
Concept-mapping and mind-mapping software are used to create diagrams of relationships between concepts, ideas or other pieces of information.
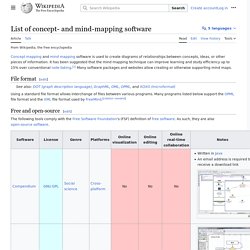
It has been suggested that the mind mapping technique can improve learning/study efficiency up to 15% over conventional note taking.[1] There are a number of software packages and websites that allow the creation of, or otherwise support mind maps. File format[edit] Using a standard file format allows interchange of files between various programs. Many of the programs listed below support the mm format used by FreeMind. The mm format is an XML text format consisting of tagged objects. Free Software[edit] The following tools are free as defined by the Free Software Foundation. Freeware[edit] The following is a list of notable concept mapping and mind mapping applications which are freeware (they are available at no cost).
Paid software[edit]