
Seeing Like a Network — The Message. We live with and in networks every minute of everyday.
These networks lay over each other and touch all over the place. Once we start thinking about them, what they’re shaped like, where we are in them, our contemporary world starts to make more sense. Consider this partial list of networks we live in, and think about where you are in them at any given moment: internet (obviously)cell tower networkstelephone wiresroad networkselectrical gridscable networkslegal networksmanufacturing networksmaterial goods distribution, shippingwater and sewagesocial networking sitessocial networks (different thing!)
Food networksetc. ad nauseam. Calling All Hackers: Help Us Build an Open Wireless Router. EFF is releasing an experimental hacker alpha release of wireless router software specifically designed to support secure, shareable Open Wireless networks.
We will be officially launching the Open Wireless Router today at the HOPE X (Hackers on Planet Earth) conference in New York City, aiming to bring aboard members of the hacker community. This release is a work in progress and is intended only for developers and people willing to deal with the bleeding edge. The software aims to do several things that existing routers don't do well—or don't do at all. We are beginning a journey that we hope will attract supporters and fellow travelers to help reach the following goals: HP Labs’ “Machine” dissolves the difference between disk and memory. John Sontag has seen the future—or at least Hewlett-Packard’s version of it.
Sontag, vice president and director of Systems Research at HP Labs, has been in charge of the team developing “The Machine,” an experimental piece of computing hardware that HP executives hope will be the template upon which the future of networked computing is built. In an interview with Ars, Sontag explained how the core technologies of The Machine—memristor-based memory and low-cost silicon-to-optic interfaces—will change the shape of computing.
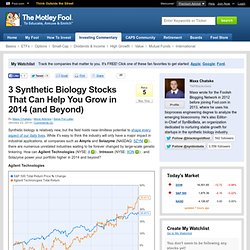
The Machine is a hyper-dense collection of computing hardware that could be used in anything from a data center to a mobile device. It has terabytes of storage and a much smaller power draw than today’s computing devices—all because of memristor-based memory and optical interconnects. Synthetic-biology firms shift focus. Patrick Boyle/Ginkgo BioWorks Yeast has been engineered by Ginkgo BioWorks to produce a fragrance ingredient.

Plain old vanilla doesn’t impress Neil Goldsmith, chief executive of Evolva, a synthetic-biology company based in Reinach, Switzerland. This year, his company will release a product that has been created by genetically modified yeast that converts sugars to vanillin. It will be the first major synthetic-biology food additive to hit supermarkets. 3 Synthetic Biology Stocks That Can Help You Grow in 2014 (and Beyond) Synthetic biology is relatively new, but the field holds near-limitless potential to shape every aspect of our daily lives.
While it's easy to think the industry will only have a major impact in industrial applications, at companies such as Amyris and Solazyme (NASDAQ: SZYM ) , there are numerous unrelated industries waiting to be forever changed by large-scale genetic tinkering. How can Agilent Technologies (NYSE: A ) , Intrexon (NYSE: XON ) , and Solazyme power your portfolio higher in 2014 and beyond? Agilent Technologies. Infographic: The Worst Jobs Throughout History. Infographic: The Signature Cocktails Of Your Favorite Fictional Boozehounds. Don Draper drinks an Old Fashioned because he’s a man . Rocky Balboa drank his protein shakes--five raw eggs--for strength.
Phil drank sweet vermouth because it was Rita’s favorite libation in Groundhog’s Day (and he was trying to get her into bed). An Online Memorial for Steve Jobs. Hewlett Packard During his freshman year at Homestead High, Jobs built a frequency counter that relied on parts from Hewlett-Packard.
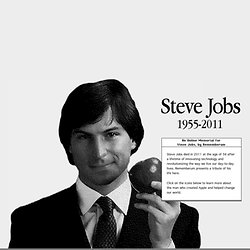
To get these parts, Jobs called HP CEO Bill Hewlett at his home. Hewlett gave him the parts needed, as well as the bonus of a summer job with the company on an assembly line for frequency counters. Tidemark's Infographics Could Change How Your Business Is Run. It’s only been a few months since Tidemark, a bold Andreessen Horowitz-backed business analytics platform, emerged from its beta cocoon.
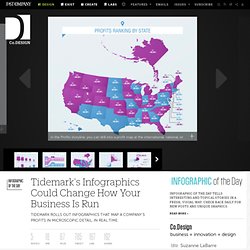
But today, the fledgling company is introducing a new set of tools, aimed at helping businesses visualize their data in real time. “Business reporting is broken, stagnated decades ago, built upon stacks of dense, complex, and dated reports and dashboards that few people ever read,“ explains Founder and CEO Christian Gheorghe. "Data is nothing without context. " The new feature--called Storylines--supplies visual context with a dynamic mobile interface.
Gheorghe’s business is based on a simple insight--that the so-called “consumerization of technology” is having a profound impact on enterprise, thanks to the ubiquity of mobile devices. Infographic: The Grinders Vs. The Dreamers. Who Wins? To be great at your job, you have to embrace the grind. But the very word implies pulverizing something into nothing, as if with every type of your keyboard, your fingers flake away until work has consumed your wrists, elbows, shoulders, and chest. Sorry! Don’t think about that visual! Here’s a better one, by Joey Roth, that imagines the grind not as a platform for powder, but as the step-by-step means to ascension. Creepy Infographic Maps The Relationships Of Every Twitter Employee. What's The Secret To Great Infographics? In the early aughts, Kim Rees loaded a single website and had a life-changing experience.

It was IBM’s Glass Engine, an interactive visualization of composer Philip Glass’s work. The software featured some amazing capabilities, like rearranging over 60 of his compositions with a few clicks of a mouse. Since graduating from NYU with a computer science degree in hand, she’d worked on interactive installations, Flash games, and more traditional web design with partner Dino Citraro.
But the Glass Engine was different. It was information she could actually hear and feel. Infographic: An App That Maps The Web In Real Time. Mankind loves making maps, and the world wide web, densely interconnected and phenomenally complex, always makes for a nice visual.
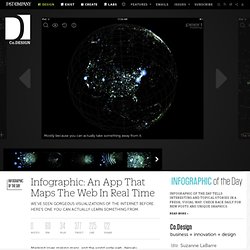
Typically these take the form of neon blobs floating against black backgrounds, like frames captured from old Winamp plug-ins, and while they’re always nice to look at, they don’t always do much in the way of helping us understand the massive global network we traverse every day. This latest effort, however, is a little different. Called simply Map of the Internet, it’s as informative as it is beautiful. Infographic: How People Died In The 20th Century. Statistically speaking, you may be likely to die of a different ailment than your grandfather (or great-grandfather).
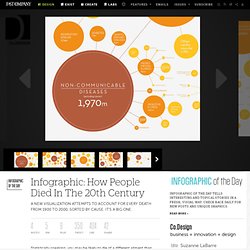
Death evolves alongside life, as medicine improves and lifestyles shift. It’s rare to see this continuum laid out in a quantifiable form, which makes this infographic by British data journalist David McCandless (of Information is Beautiful) so fascinating. Commissioned by the Wellcome Trust, a U.K. charity devoted to human health, Death in the 20th Century shows us the leading causes of mortality from 1900 to 2000, worldwide. Infographic: Kickstarter Dominates Indie Innovation. Like YouTube, Facebook, or blogging platforms, it’s almost hard to believe there was an Internet without Kickstarter, which may be the greatest testament to its success. In 2009, the site generated about $23 million for its projects--an impressive figure by all accounts--but in 2012, Kickstarter pulled in roughly 10 times that, leapfrogging the grant budget of the National Endowment for the Arts.
You can find all those facts and many more in this masterful infographic created for Fast Company by Catalogtree and reported by Skylar Bergl, Jeffrey Cattel, and Lindsey Kratochwill: The Most Terrifying Drone Video Yet. The Saddest Map In America. Maps as Propaganda. Infographic: The Languages Of New York, Mapped By Tweets. It looks like every block of NYC has been wrapped in Christmas lights, but in reality, you’re looking at the nine most prominently tweeted languages across the city (aside from English). Can This Design Student Build An Open-Source Alternative To GPS? Infographic: The Average Income For Every Neighborhood In America.
No matter where you live, you probably already have some sort of mental map of where the money resides in your city. Soviet TV advertisements from the 1970s and 1980s. Cell phone tracking system reveals how traffic jams start. Why Big Testing Will Be Bigger Than Big Data.