
SAAS Business Intelligence. Maltego 3. Needlebase. Data Analysis Software, Marketing Data Mining & Customer Data Analysis Software - FastStats Discoverer. Visual Fusion - Software Components. Schedule a Live Demo!

Contact us today for a private tour of the Visual Fusion platform. SCHEDULE TOUR Map-based visualizations for everyone, ready in days, not months Visual Fusion is a platform for building map-based solutions that organizations can use to increase strategic insight and make informed decisions. With Visual Fusion, you can quickly build beautiful, powerful visualizations that unite data from multiple sources and systems on an interactive map, timeline, charts, and graphs. Whether you need an application for your enterprise, your business unit, or your clients, Visual Fusion is the shortest route to visualizations that increase insight and productivity. Visual Fusion lets users analyze data in multiple insight-producing ways, with themed styling, charts and a timeline. Interactive filters let user slice-and-dice data to find what's most significant.
With Visual Fusion, you spending less time finding information and have more ways to analyze it. Accelerate insights. Easy to Use. Wrangler. UPDATE: The Stanford/Berkeley Wrangler research project is complete, and the software is no longer actively supported.
Instead, we have started a commercial venture, Trifacta. For the most recent version of the tool, see the free Trifacta Wrangler. Why wrangle? Too much time is spent manipulating data just to get analysis and visualization tools to read it. Wrangler is designed to accelerate this process: spend less time fighting with your data and more time learning from it. Mashups, APIs, and the Web as Platform. The R Project for Statistical Computing. Gephi, an open source graph visualization and manipulation software.
Cytoscape: An Open Source Platform for Complex-Network Analysis and Visualization. Protovis. Protovis composes custom views of data with simple marks such as bars and dots.
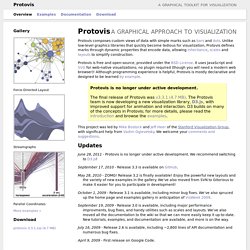
Unlike low-level graphics libraries that quickly become tedious for visualization, Protovis defines marks through dynamic properties that encode data, allowing inheritance, scales and layouts to simplify construction. Protovis is free and open-source, provided under the BSD License. It uses JavaScript and SVG for web-native visualizations; no plugin required (though you will need a modern web browser)! Although programming experience is helpful, Protovis is mostly declarative and designed to be learned by example. Protovis is no longer under active development.The final release of Protovis was v3.3.1 (4.7 MB). This project was led by Mike Bostock and Jeff Heer of the Stanford Visualization Group, with significant help from Vadim Ogievetsky. Updates June 28, 2011 - Protovis is no longer under active development.
September 17, 2010 - Release 3.3 is available on GitHub. May 28, 2010 - ZOMG! Getting Started. Google Refine. Scraping for Journalism: A Guide for Collecting Data. Photo by Dan Nguyen/ProPublica Our Dollars for Docs news application lets readers search pharmaceutical company payments to doctors.
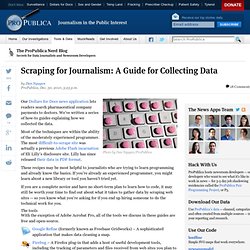
We’ve written a series of how-to guides explaining how we collected the data. Most of the techniques are within the ability of the moderately experienced programmer. The most difficult-to-scrape site was actually a previous Adobe Flash incarnation of Eli Lilly’s disclosure site. Lilly has since released their data in PDF format. These recipes may be most helpful to journalists who are trying to learn programming and already know the basics. If you are a complete novice and have no short-term plan to learn how to code, it may still be worth your time to find out about what it takes to gather data by scraping web sites -- so you know what you’re asking for if you end up hiring someone to do the technical work for you.
The tools With the exception of Adobe Acrobat Pro, all of the tools we discuss in these guides are free and open-source. A Guide to the Guides. Firebug.