
European Central Bank home page. Moving insight to the next dimension. Moody's Analytics: Economic Analysis, Data, Forecasting and Credit Risk Management. World Competitiveness Yearbook (WCY) Economic Indicators: Main Page. FRASER » Federal Reserve Archival System for Economic Research. EconData.Net Home Page. Social Indicators of Development. Trends in Developing Economies. World Bank Copyright 1995 by the International Bank for Reconstruction and Development/The World Bank Abstract/Summary Trends in Developing Economies (TIDE) provides brief reports on most of the World Bank's borrowing countries.
World Tables - Dataset Description Guide. Dataset Abstract/Summary World Tables, published annually, provides the most detailed collection of economic data and socioeconomic indicators published by the World Bank.
Standardized data presented for numerous inividual countries (161,1994 edition) make this an ideal reference for international comparisons. A Supplement containing revised data is published approximately six months after the main volume. Data are presented as annual times series covering multiple years (1972-1992, 1994 edition), and are presented as Topical Pages or as Country Pages. The World Factbook. Producer Price Index (PPI) Statistical Reference Shelf. Cost-Of-Living Adjustments.
Financial Stability Review. Financial stability can be defined as a condition in which the financial system – comprising of financial intermediaries, markets and market infrastructures – is capable of withstanding shocks, thereby reducing the likelihood of disruptions in the financial intermediation process which are severe enough to significantly impair the allocation of savings to profitable investment opportunities.
The three parts of the financial system: financial intermediaries, such as banks, insurance companies and other institutional investors that direct funds from those willing to invest/lend to those who want to borrow. Financial markets, where lenders and borrowers meet. Examples are money markets and stock exchanges. Financial market infrastructures through which money and financial assets flow between buyers and sellers. ECB - Publications. "The international role of the euro" Description: This is the 12th annual review of the international role of the euro published by the ECB.
It presents the main findings of the continued monitoring and analysis conducted by the ECB and the Eurosystem as regards the development, determinants and implications of the use of the euro by non-euro area residents. This review also examines in greater depth issues that have a bearing on the euro’s international role and the global currency order, including prospects for non-traditional reserve currencies and a multi-polar international monetary system. This analysis is presented in the form of three special features. Contents: 1. Language: 1.78 MB en ePUB version: 14.1 MB en [Hard copies available in EN] Consumer Price Index (CPI) The Consumer Price Indexes (CPI) program produces monthly data on changes in the prices paid by urban consumers for a representative basket of goods and services.
CPI for all items falls 0.1% in December as energy and food indexes decline On a seasonally adjusted basis, the Consumer Price Index for All Urban Consumers declined 0.1 percent in December after being unchanged in November. The index for all items less food and energy rose 0.1 percent in December after increasing 0.2 percent in November. HTML | PDF | RSS | Local and Regional CPI Current CPI Economic News Releases CPI News Release (HTML) (PDF) Subscribe to the BLS News Service—receive the Consumer Price Index news release by e-mail.
Archived Consumer Price Index History Table: The Internet's Library of Economic Statistics. The 2010 Statistical Abstract. What is the Statistical Abstract?
The Statistical Abstract of the United States, published since 1878, is the authoritative and comprehensive summary of statistics on the social, political, and economic organization of the United States. Use the Abstract as a convenient volume for statistical reference, and as a guide to sources of more information both in print and on the Web. Sources of data include the Census Bureau, Bureau of Labor Statistics, Bureau of Economic Analysis, and many other Federal agencies and private organizations. The U.S. U.S. Bureau of Economic Analysis (BEA) - bea.gov Home Page. USDA Briefing Room - Land Use, Value, and Management: Agricultural Land Values. National Council of Real Estate investment Fiduciaries.
Foreclosure Real Estate Listings. IndexUniverse.com. Reed Construction Data. Homepage. The National Bureau of Economic Research. Table of Contents- Rates and Statistics- Bank of Canada. Turner Construction Company -Building Cost Index; Construction Cost. Turner Projects Continued Growth in Construction Costs Second Quarter 2016 Turner Building Cost Index—which measures costs in the non-residential building construction market in the United States—has increased to a value of 983.
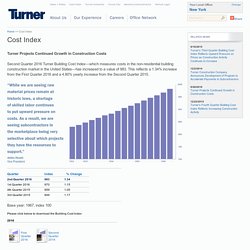
This reflects a 1.34% increase from the First Quarter 2016 and a 4.80% yearly increase from the Second Quarter 2015. Base year: 1967, index 100 Please click below to download the Building Cost Index2016 2015 2014 2013 2012 Fourth Quarter Cost Indices from Previous Years. Construction Forecast. Downloads. Gapminder Slides Download Gapminder’s slides, free to modify and use in any way you like!

Here are the slides used in our public presentations and TED talks. Gapminder Tools Offline Handouts & Lesson plans (PDF) Interactive presentations (Flash, PowerPoint etc.) Life expectancy is a very important measure when we compare the health of different countries. Use this animated presentation when you lecture about HIV. A complete package of animations for your lecture.