
Infographie ou visualisation de données, quelles différences? Infographie : la visualisation de données Les termes d’infographies ou de visualisations de données apparaissent aujourd’hui interchangeables.
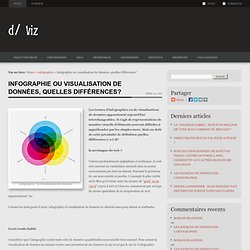
Il s’agit de représentations de manière visuelle d’éléments souvent difficiles à appréhender par les simples mots. Mais au-delà de cette proximité de définition quelles différences y-a-t-il? La novlangue du web ? Univers profondément anglophone et technique, le web crée souvent un vocabulaire assimilé plus ou moins correctement par tout un chacun. Comme les mots geek et nerd, infographie et visualisation de données se côtoient sans pour autant se confondre. Excel rendu lisible Considérer que l’infographie exclut toute idée de données quantifiables nous semble bien excessif. Warksobservatory.files.wordpress.com/2012/07/unemployment-horizon-chart.pdf.
Files/papers/data-visualization.pdf. Hal.archives-ouvertes.fr/docs/00/72/08/24/PDF/Wood_2012_SRI.pdf. Humanities+Design @ Stanford. Visualizing the Creative Commons licenses of webpages you’ve visited, data to visual in 10 minutes. Over the last few months, I’ve been drawn towards looking for ways people can create visualizations of data they own that can help them better understand their participation and habits on the Web.
In my own research, I’m using a free web-based data visualization tool to understand how grantees of the TACT program are reporting their experience working with OER. The app I’m reference is called RAW, and is a free browser-based app that takes advantage of javascript (d3.js) to let just about anyone visualize datasets in a variety of graph types. It’s being developed by a group called Density Design, based in Milano. And if you’re using the OpenAttribute browser plugin, you already have a dataset worth taking a look at inside their app. While checking a website for a proper machine-readable license by using OpenAttribute earlier this week (by clicking on the attribution man in the address bar), I noticed a button labeled, “More Data” when the dialogue box dropped down.
Like this: GED VIZ – Visualizing Global Economic Relations. Programmes - Data Journalism Awards 2014. Listening to the digital city. I am a PhD. Visualizing the User Generated City. Telltale is a research project conducted among three different departments of Politecnico di Milano (Design department, DAStU department of Architecture and Ur- ban Studies, DEIB department of Electronics, Information and Bioengineering).
It is a research project leveraging the collaboration between computer sciences, social and urban studies and design disciplines at Politecnico di Milano. Urban Demographics: Urban Density Patterns in 9 Global Cities. A Cartographic Turn? Bridging the Gap between Sciences and Technologies of the Inhabited Space.
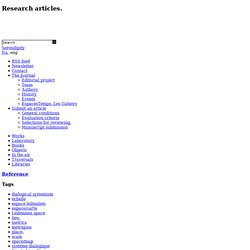
Jacques Lévy a Once upon a time, there was a town named Madaba. Then and there, map-making was the vanguard of space-thinking. Figure 1 – A Cartogram of Palestine, in the church of Madaba [Jordan], 6th century AD (©Jacques Lévy, 2007). 30 Simple Tools For Data Visualization. There have never been more technologies available to collect, examine, and render data.
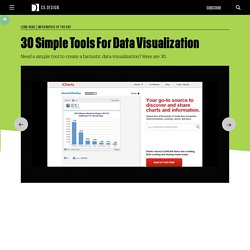
Here are 30 different notable pieces of data visualization software good for any designer's repertoire. They're not just powerful; they're easy to use. In fact, most of these tools feature simple, point-and-click interfaces, and don’t require that you possess any particular coding knowledge or invest in any significant training. Let the software do the hard work for you. Your client will never know. Gephi, an open source graph visualization and manipulation software. Project targets common humanitarian data collection. TaskJuggler - A Free and Open Source Project Management Software - About TaskJuggler. The Data Visualisation Catalogue. Essential Resources: Programming languages, toolkits and libraries. This is part of a series of posts to share with readers a useful collection of some of the most important, effective and practical data visualisation resources.
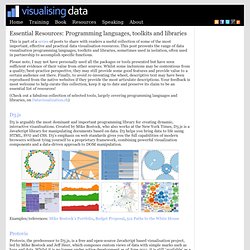
This post presents the range of data visualisation programming languages, toolkits and libraries, sometimes used in isolation, often used in partnership to accomplish specific functions. Please note, I may not have personally used all the packages or tools presented but have seen sufficient evidence of their value from other sources. Whilst some inclusions may be contentious from a quality/best-practice perspective, they may still provide some good features and provide value to a certain audience out there. Finally, to avoid re-inventing the wheel, descriptive text may have been reproduced from the native websites if they provide the most articulate descriptions.
Your feedback is most welcome to help curate this collection, keep it up to date and preserve its claim to be an essential list of resources! D3.js Protovis Vega Processing. CY 2013 Nationwide Simultaneous Earthquake Drill. Video Revolution: 100+ Ways to Watch and Create TV, Film and Web Video. This post is #10 in DailyTekk’s famous Top 100 series which explores the best startups, gadgets, apps, websites and services in a given category.
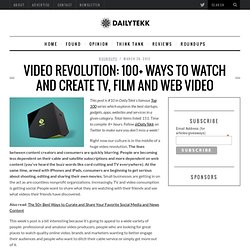
Total items listed: 151. Time to compile: 8+ hours. Follow @DailyTekk on Twitter to make sure you don’t miss a week! Right now our culture is in the middle of a huge video revolution. The lines between content creators and consumers are quickly blurring.