
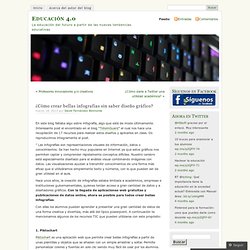
Cómo crear bellas infografías sin saber diseño gráfico. Las infografías son representaciones visuales de información, datos o conocimientos.
Se han hecho muy populares en Internet ya que estos gráficos nos permiten captar y comprender rápidamente conceptos difíciles. Nuestro cerebro está especialmente diseñado para el análisis visual combinando imágenes con datos. Las visualizaciones ayudan a transmitir conocimientos de una forma más eficaz que si utilizáramos simplemente texto y números, con lo que pueden ser de gran utilidad en el aula. Hace unos años, la creación de infografías estaba limitada a académicos, empresas e instituciones gubernamentales, quienes tenían acceso a gran cantidad de datos y a diseñadores gráficos. Con la llegada de aplicaciones web gratuitas y publicaciones de datos online, ahora es posible para todos crear bellas infografías. Con ellas los alumnos pueden aprender a presentar una gran cantidad de datos de una forma creativa y divertida, más allá del típico powerpoint. ¿Cómo crear bellas infografías sin saber diseño gráfico?
En este blog faltaba algo sobre infografía, algo que está de moda últimamente.
Interesante post el encontrado en el blog “TotemGuard” el cual nos hace una recopilación de 17 recursos para realizar estos diseños y aplicarlos en clase. 20+ Tools to Create Your Own Infographics. A picture is worth a thousand words – based on this, infographics would carry hundreds of thousands of words, yet if you let a reader choose between a full-length 1000-word article and an infographic that needs a few scroll-downs, they’d probably prefer absorbing information straight from the infographic. What’s not to like? Colored charts and illustrations deliver connections better than tables and figures and as users spend time looking back and forth the full infographic, they stay on the site longer.
Plus, readers who like what they see are more likely to share visual guides more than articles. While not everyone can make infographics from scratch, there are tools available on the Web that will help you create your very own infographics. In this article, we’re listing more than 20 such options to help you get your messages across to your readers, visually. Read Also: The Infographic Revolution: Where Do We Go From Here? Infographic App & Presentation Tool.
Vizualize.me: Visualize your resume in one click. Many Eyes. Eight Free tools for Teachers to Make Awesome Infographics. 1- Easel.ly This is a great tool that allows users to create visually rich infographics from pre-designed themes.
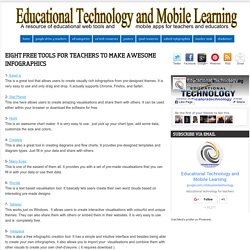
It is very easy to use and only drag and drop. It actually supports Chrome, Firefox, and Safari. 2- Stat Planet This one here allows users to create amazing visualisations and share them with others. It can be used either within your browser or download the software for free. 3- Hohli This is an awesome chart maker. 4- Creately This is also a great tool in creating diagrams and flow charts. 5- Many Eyes This is one of the easiest of them all.
10 herramientas gratuitas para hacer excelentes Infografías. Explore Data Visualizations. Creating Infographics with Students. Dazzle your data handling class with an infographic project. Infographics are: fun, informative, inspiring, thought-provoking, knowledge-enhancing, stimulating and above all, engaging.
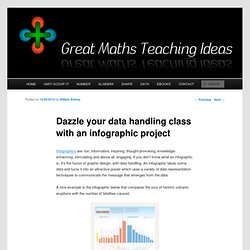
If you don’t know what an infographic is, it’s the fusion of graphic design, with data handling. An infographic takes some data and turns it into an attractive poster which uses a variety of data representation techniques to communicate the message that emerges from the data. A nice example is the infographic below that compares the size of historic volcanic eruptions with the number of fatalities caused. Click on the image to see it full-size. The Best Resources For Creating Infographics. Infographics are visual representations of data design to help communicate information clearly.
They are great for English Language Learners, and the rest of us, too! The information can also be either serious or humorous. To see examples of some of the best ones, you can visit: The Best Infographics — 2010 The Best Interactive Infographics — 2009 You can find even more at The Best Sources For Interactive Infographics and A Collection Of “The Best…” Lists On Infographics. Of course, you don’t need online resources to have students create their own infographics that can be used towards achieving numerous learning outcomes, as I recently posted about at What A Great Infographic To Use As A Model For Students. However, creating them online can also be both useful and fun — for both teachers and students. Here are my choices for The Best Resources For Creating Infographics: I’m going to start-off with some of my previous “The Best…” lists, including:
INFOGRAPHIC : Where Is The World’s Data Being Stored? The Biggest Shift Since the Industrial Revolution [Infographic] You’ve probably already seen this great infographic on social media from by en.gauge.media. If not, take a look at the staggering statistics on the social media shift. Look at everything that has happened in the past 5 years. What do these numbers mean for educators? The easy answer is that it should not be able to ignore such a societal shift by filtering, banning or whatever you’d like to call it policies. It’s hard to believe the evolution (revolution) of social media in the past 5 years.
As I looked through the infographic, the most surprising statistic for me was finding out that 80% of Twitter usage is on mobile devices. How the Internet works Infographic. Infographic Labs — Custom Infographics Design. InfoGraphics (Visual Maps) Infografías.