
Fusion Tables - Gather, visualize, and share data tables online. Bust your data out of its silo!

Get more from data with Fusion Tables. Fusion Tables is an experimental data visualization web application to gather, visualize, and share data tables. Visualize bigger table data online Filter and summarize across hundreds of thousands of rows. Then try a chart, map, network graph, or custom layout and embed or share it. Two tables are better than one! Merge two or three tables to generate a single visualization that includes both sets of data. Make a map in minutes Host data online - and stay in control Viewers located anywhere can produce charts or maps from it. Visualize bigger table data online Import your own data Upload data tables from spreadsheets or CSV files, even KML. Visualize it instantly See the data on a map or as a chart immediately. Publish your visualization on other web properties Now that you've got that nice map or chart of your data, you can embed it in a web page or blog post.
Two tables are better than one! Make a map in minutes. Brainstorming and Mind Mapping Software. Make a Mind Map Online! - Mindomo. GraphWords.com - Visualize words! Glogster: make a poster online. It's free!
StatPlanet - Interactive Maps of World Stats. Public Data Explorer. Free Data Visualization Software. Draw Diagrams Online using Collaborative Diagram Tools. Online Charts Builder. Hohli Online Charts Builder New version: Try new version of Charts Builder, it based on new Google Charts API Load From Image URL: Chart Data can't equal to original, but very similar to it.

Only for images on chart.apis.google.com Chart Type: 3D Pie charts Lines Bar charts Pie charts For Pie Charts with labels choose 1000x300 or 800x375 size Venn diagrams Scatter plots Radar charts Chart Size: 320x240 Horizontal 1000x300 800x375 600x500 320x240 Vertical 300x1000 375x800 500x600 240x320 Square 546x546 400x400 300x300 200x200. Beautiful web-based timeline software. OurStory.com - Capture your stories, save them permanently. Make an Amazing Timeline in Minutes. Share Photos, Videos, Text, Music and Documents Easily. Create timelines, share them on the web. Explore and Create Free Timelines. Chart of the day.
Zondle.com - Fun Learning Games For Kids That Teachers Can Customize. Home > Online > Zondle.com - Fun Learning Games For Kids That Teachers Can Customize It's not always easy for teachers to keep kids enthralled with learning these days.
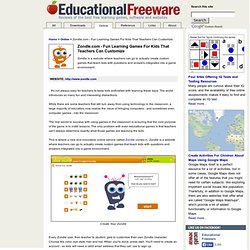
The world introduces so many fun and interesting distractions. While there are some teachers that still turn away from using technology in the classroom, a large majority of educators now realize the value of bringing computers - and sometimes even computer games - into the classroom. The real secret to success with using games in the classroom is ensuring that the core purpose of the game is to instill lessons. The only problem with even educational games is that teachers can't always determine exactly what those games are teaching the kids.
This is where a new and innovative online service called Zondle comes in. Create Your Zondle Every Zondle user, from teacher to student, gets to customize their own Zondle character. Main Page When you first log into your Zondle account, it can feel rather unimpressive. Creating a Topic. Qwiki. GroupZap — Welcome. Edistorm - Edistorm - Online Brainstorming and Planning. Add a sticky note and post it online. Visual Thinking Evolution. A mind map is a diagram used to represent words, ideas, tasks, or other items linked to and arranged around a central key word or idea.

Especially in British English, the terms spidergram and spidergraph are more common,[1] but they can cause confusion with the term spider diagram used in mathematics and logic. Mind maps are used to generate, visualize, structure, and classify ideas, and as an aid to studying and organizing information, solving problems, making decisions, and writing. The elements of a given mind map are arranged intuitively according to the importance of the concepts, and are classified into groupings, branches, or areas, with the goal of representing semantic or other connections between portions of information. Mind maps may also aid recall of existing memories. By presenting ideas in a radial, graphical, non-linear manner, mind maps encourage a brainstorming approach to planning and organizational tasks. Reference: wikipedia.
Infographic on The Digital Classroom. Mind42.com - Collaborative mind mapping in your browser.