
Architecture diagrams. InfiniteCitySolnitMonarchscloseup. Infinite City Fillmore. Where dey at bounce map. Site Analysis - NEXT.cc. Every site, like every person, is unique.
Places are located by their position on a continent, in a country in a watershed. Sites are specific locations in longitude and latitude. Each location is a unique collection of the past, the present and the future of life. What was this place like…before? What animals and plants and insects thrived here? Experiencing a site happens over time in glimpses and fragments that selectively form images in our minds and eventually sensory memories. Mapping Urban Complexities. 2anything at all.
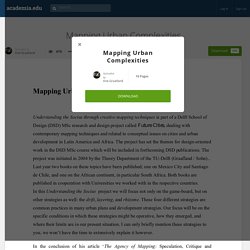
This will also be the main issue in the MSc project we will run on MexicoCity, a project dealing with urban asymmetries. In this, the questions of mapping as practice, and of the map as an instrument, become paramount. These questions render Corner’s contribution not only interesting, but also especially timely and relevant, since it provides an opening for the problems we are facing in contemporary urbanism andarchitecture alike. Despite of this, theoutcomes of these debates are far from satisfactory, especially in terms of the manydiverting positions that view these issues in completely incompatible ways. Mapping Toolkit 2D. The mapping toolkit is a series of tools for creatives, to create visual content for projection mapping.

It’s comes as a pack of patches / modules developed with vvvv. MAPPING TOOLKIT – 2D A tool to animate vector files (svg format), and simply produce visual content in realtime.Points, lines and polygon animations are available. Licencing: MTK is free for non commercial use, but get in touch if you want to use it for a commercial project. Check also vvvv licence examples of use: projections onto origamis (project: paper and light) – install vvvv and its addon pack (vvvv 45beta33.3 32bits recommended) – download MAPPING TOOLKIT 2D, unzip in the vvvv folder. – run the app. TUTORIAL – Select your svg file in the drop down list. You can use illustrator, either full screen on your projector output to map directly, or with a picture on a locked layer as a reference.
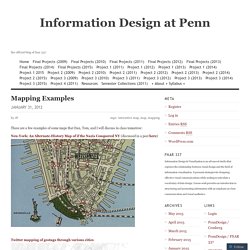
AA School of Architecture Projects Review 2012 - Inter 1 - Vere van Gool. Information Design at Penn. These are a few examples of some maps that Dan, Tom, and I will discuss in class tomorrow: Neu-York: An Alternate-History Map of if the Nazis Conquered NY (discussed in a post here) Twitter mapping of geotags through various cities Transportation check-ins on FourSquare Underskin: The Human Subway Map London Tube Map: New and Old NYC’s Design Scene Musical NYC Subway Map: Alexander Chen made a version of the NYC subway map that plays music as the trains intersect routes.
The United States of Autocomplete – This gives a whole new spin on stereotypes via Google autocomplete. Maps (kottke.org) Kottke.org posts about maps A subway-style map of the Roman roads of Britain After completing his subway-style map of the roads of the entire Roman Empire, Sasha Trubetskoy began work on a highly requested follow-up: a similar map of the Roman roads in Britain.
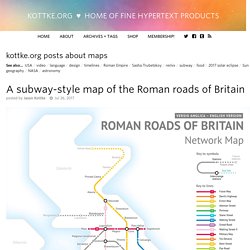
This was far more complicated than I had initially anticipated. Not only were there way more Roman Roads in Britain than I initially thought, but also their exact locations and extents are not very clear. In a few places I had to get rather creative with the historical evidence. As Wikipedia notes, most of the roads were completed by 180 AD and many of them are still in use today. After the Romans departed, systematic construction of paved highways in the UK did not resume until the early 18th century.
More about... Where People Run in Major Cities. There are many exercise apps that allow you to keep track of your running, riding, and other activities.
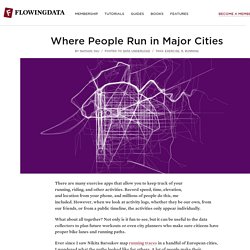
Record speed, time, elevation, and location from your phone, and millions of people do this, me included. However, when we look at activity logs, whether they be our own, from our friends, or from a public timeline, the activities only appear individually. What about all together? Not only is it fun to see, but it can be useful to the data collectors to plan future workouts or even city planners who make sure citizens have proper bike lanes and running paths. Ever since I saw Nikita Barsukov map running traces in a handful of European cities, I wondered what the paths looked like for others.
The maps below are what I got, mostly for American cities, but there are a few European cities in there too (alphabetical order). Interactive: When Do Americans Leave For Work? JavaScript required for interaction.

<br /><img src=" In a continued dig into commute data from the American Community Survey (We already saw mode of transportation.), the map above shows when people leave home for work. The rates are for people who have jobs and are 16 years or older. The data does not include people who work from home. Do we get anything interesting even though it's just one facet of the commute to work? As you'd expect, many commuters leave home between 7:00am and 8:00am. This surprised me.