
A Meandering Introduction to D3.js. Intro to Data Visualization. Intro to D3.js This class is an introduction to Data-Driven Documents, a javascript library for web visualization by Mike Bostock.
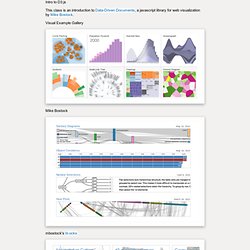
Visual Example Gallery Mike Bostock mbostock's bl.ocks Class Outline What is D3? A basic to intermediate understanding of HTML and JavaScript is required to get the most out of this class. Class structure 0:00-0:15 Introduction0:15-0:30 Learning resources0:15-0:45 Concepts for web visualization0:45-1:30 Coding Exercise1:30-2:00 Discussion Stuff I've done with d3 Various examples on Expose Data and bl.ocks.org. Average Prices Julia Set Parallel Coordinates Also check out the library I'm working on. Render Queue Motion Charts D3.js puts a lot of effort into working with data-driven transitions. Check out this video by Hans Rosling on data storytelling with statistical graphics. Dot Enter Mixtapes and Tributary. Bl.ocks.org - mbostock. Mike Bostock. December 27, 2014Mapping Every Path to the N.F.L.
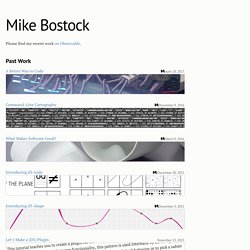
Playoffs December 20, 2014How Each Team Can Make the N.F.L. Playoffs November 5, 2014The Most Detailed Maps You’ll See From the Midterm Elections November 3, 2014How To Scroll September 19, 2014‘Stop-and-Frisk’ Is All but Gone From New York July 26, 2014Mapping the Spread of Drought Across the U.S. June 26, 2014Visualizing Algorithms June 15, 2014Three Little Circles May 22, 2014Is It Better to Rent or Buy? May 6, 2014Let’s Make a Bubble Map April 22, 2014Who Will Win The Senate? March 7, 2014Let’s Make a Block Feburary 14, 2014Front Row to Fashion Week. Cubism. Mike Bostock Square, Inc. * for monitoring of production systems How do we use visualization?

Anomaly detection - observe abnormal activity Capacity planning - extrapolate non-linear trends Crisis diagnosis - see interactions between services System design - don’t guess; decide empirically What are the benefits of visualization? Faster diagnosis - reduce impact Discovery of unexpected behavior - prevent downtime Increased situational awareness - make better decisions Or: The strengths & weaknesses of human perception.
Why is visualization hard? Data is not information - transform data to make it meaningful Some visual channels are less effective - favor position Integrality is hard to avoid - three dimensions max. Aspect ratios matter. Stacking makes middle layers hard to read. Garish colors can be hard to see. Load and render data incrementally. Make better use of modern browsers. Combine position and color to reduce vertical space. A small library, not a system. Why a context? CPU (10s) Network (10s) D3.js - Data-Driven Documents. Arbor.js. Backbone.js. Backbone.js gives structure to web applications by providing models with key-value binding and custom events, collections with a rich API of enumerable functions, views with declarative event handling, and connects it all to your existing API over a RESTful JSON interface.
The project is hosted on GitHub, and the annotated source code is available, as well as an online test suite, an example application, a list of tutorials and a long list of real-world projects that use Backbone. Backbone is available for use under the MIT software license. You can report bugs and discuss features on the GitHub issues page, on Freenode IRC in the #documentcloud channel, post questions to the Google Group, add pages to the wiki or send tweets to @documentcloud. Backbone is an open-source component of DocumentCloud. Downloads & Dependencies (Right-click, and use "Save As") Online Charts Builder. Hohli Online Charts Builder New version: Try new version of Charts Builder, it based on new Google Charts API Load From Image URL: Chart Data can't equal to original, but very similar to it.

D3.js - Data-Driven Documents. Envision - demos. Timeline JS. Highcharts - Interactive JavaScript charts for your webpage. Flot: Attractive JavaScript plotting for jQuery. Dynamic Mathematics with JavaScript. Rickshaw. Graphing Toolkit Rickshaw provides the elements you need to create interactive graphs: renderers, legends, hovers, range selectors, etc.
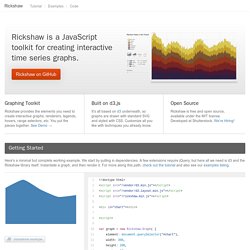
You put the pieces together. See Demo → Built on d3.js It's all based on d3 underneath, so graphs are drawn with standard SVG and styled with CSS. Open Source Rickshaw is free and open source, available under the MIT license. Getting Started Here's a minimal but complete working example. Area Graphs Lines Bars Scatterplot Interactive Legend Add a basic legend: Add functionality to toggle series' visibility on and off: Highlight each series on hover within the legend: Add drag-and-drop functionality to re-order the stack (requires jQueryUI): Interactive Hover Details Show the series value and formatted date and time on hover: Specify formatting callbacks to customize output: See the custom formatter and subclass examples for more. Annotations Add toggleable annotations: annotator.add(timestamp, message);annotator.update(); Range Slider Graphs & Data via AJAX / JSONP Tutorial. AmCharts - JavaScript Chart Library.