
2015 World Population Interactive Map. Download: 2015 World Population Data Sheet (PDF: 2.5MB) Explore: Digital Visualization Read: Data Show Gains For Women, But More Progress Needed Teach: Lesson Plan Disclaimer Due to their size, the following countries and territories are not represented on the map: Faro Island, Denmark; Gibraltar; Hong Kong SAR; Liechtenstein; Maldives; Monaco; San Marino; St.
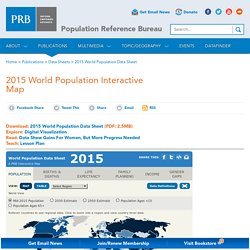
Helena Island; and Vatican City. Notes The Data Sheet lists all geopolitical entities with populations of 150,000 or more and all members of the UN. Sub-Saharan Africa: All countries of Africa except the northern African countries of Algeria, Egypt, Libya, Morocco, Sudan, Tunisia, and Western Sahara. World and Regional Totals: Regional population totals are independently rounded and include small countries or areas not shown.
World Population Data Sheets from different years should not be used as a time series. Sources. eAtlas of Gender is launched. Gender equality matters for development The education and health levels of women and girls have improved greatly over the years.
But in many parts of the world, women are still dying in childbirth, or not being born at all, at alarming rates. Women continue to lack voice and decision-making ability in the household and in society; and, their economic opportunities remain very constrained. This inequality is manifestly unfair. It is also bad economics: under-investing in girls and women puts a brake on poverty reduction and limits economic and social development. Two new products from the World Bank inform, through data, the progress of over 200 countries towards gender equality and development. La population en cartes.
Crédits Conception : Gilles Pison, Hélène Mathian, Christine Plumejeaud, Jérôme Gensel, l'équipe web de l'InedRéalisation : OpixidoSources statistiques : Nations Unies, projections de population mondiale ( ) Une animation de l'Institut national d'études démographiques, conçue en partenariat avec le Groupe Hypercarte (Laboratoire Géographie-Cités du CNRS et des Universités Paris 1 et Paris 7 et Laboratoire d'informatique de Grenoble - Université Joseph Fourier)
AIRE. Earth Atlas. Interactive Historical World Atlas. Europe by numbers: the complete interactive guide. Welcome to INSPIRE geoportal. Bhuvan - Gateway to Indian Earth Observation. L'observatoire du Littoral: Accueil. StatPlanet – Visualisation interactive de données par le biais d. Des améliorations sont régulièrement apportées à StatPlanet.

Vérifiez régulièrement le site web pour les mises à jour et les nouvelles fonctionnalités. Pour de plus amples informations, contactez Frank van Cappelle. Plus de 300 indicateurs de développement internationaux La base de données de StatPlanet comprend des données démographiques, d'éducation, de santé, d’environnement et des indicateurs socio-économiques provenant des sources suivantes: Vous pouvez également ajouter vos propres données en utilisant StatPlanet - Map Maker.
A propos de StatPlanet StatPlanet est un logiciel gratuit pour la création de visualisation hautement interactive de données aux échelles nationales et régionales. Le programme de recherche StatPlanet (la conception, la mise au point et le développement) a été lancé en 2005 par Frank van Cappelle. Les fonctionnalités de StatPlanet - Télécharger le PDF Des cartes interactives: World.
Our Changing World: The Coffee Effect. ProductsOfSlavery. SISTER -atlas interactif. Human Development Trends, 2005. Hypercities Beta 2. Indicateurs internationaux de développement humain - PNUD. Target Maps: faire de la cartographie quantitative en important vos fichiers excel. Statistical Atlas. ILOG Elixir Blog Samples: World Factbook Second Edition.