
Reports & Downloads. Ad Age Data Center Agency Info, Timelines, Contacts and More. About Ad Age's agency data The earliest Advertising Age data ranking agencies dates from 1943.
Rankings initially appeared as the Agency Billings Report, then Agency Gross Income Rankings and most recently as the Agency Report. Data on this site begin with the 1998 edition, which includes figures for 1996 and 1997. Multi-tiered rankings Agencies and agency companies are ranked on several levels. Agency companies (sometimes holding companies) are the top level. This level may include independent agencies if they are of sufficient size. Consolidated agency networks are the second level. The third level ranks agencies (or agency brands), often by discipline and without regard to the sibling shops in the same ranking. A consolidated agency network may share the same name as an agency brand. Rankings by discipline and the 75% rule Rankings also include specialty disciplines, such as digital, search, direct, promotion, media, health care, African-American, Hispanic and Asian.
Advertising Age. Digital Family Trees 2012. World Internet Usage Statistics News and World Population Stats. Top 100 Stats. Agriculture Statistics and graphs related to agriculture are found here.

How many agricultural workers are there per hectare? Tractors? Which country produces the maximum cotton? Who is the biggest exporter of bananas? TOP STATS: Agricultural machinery > Tractors, Arable land > Hectares, Agricultural growth and 306 more Background What is the background of the country? TOP STATS: Overview, Full name Cost of living TOP STATS: Transport prices > Gas/petrol > 1 litre, Real estate prices > Interest rate, Real estate prices > Apartment purchase price per sqm > Outside city centre and 50 more Crime No explanation needed for this section.
TOP STATS: Rapes, Murders > Per capita, Total crimes and 155 more Disasters The tsunami rocked the civilized world with its widespread devastation. TOP STATS: Tsunami > Death toll, Tsunami > Foreigners death toll, Tsunami > Funds pledged and 43 more Economy This category is all about money. TOP STATS: GDP per capita, GDP, Population below poverty line and 3530 more. Your Weight on Other Worlds. Ever wonder what you might weigh on Mars or The Moon?
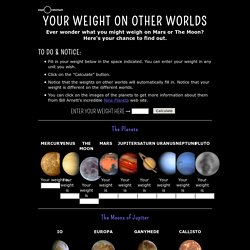
Here's your chance to find out. <div class="js-required"><hr> This Page requires a Javascript capable browser <hr></div> Fill in your weight below in the space indicated. You can enter your weight in any unit you wish. Click on the "Calculate" button. Mass and Weight Before we get into the subject of gravity and how it acts, it's important to understand the difference between weight and mass. We often use the terms "mass" and "weight" interchangeably in our daily speech, but to an astronomer or a physicist they are completely different things. Weight is an entirely different thing. If you are in a spaceship far between the stars and you put a scale underneath you, the scale would read zero. The Relationship Between Gravity and Mass and Distance As stated above, your weight is a measure of the pull of gravity between you and the body you are standing on.
The two "M's" on top are your mass and the planet's mass. Isaac Newton. Making Science Graphs and Interpreting Data. Most scientific graphs are made as line graphs.
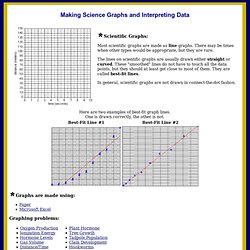
There may be times when other types would be appropriate, but they are rare. The lines on scientific graphs are usually drawn either straight or curved. These "smoothed" lines do not have to touch all the data points, but they should at least get close to most of them. They are called best-fit lines. In general, scientific graphs are not drawn in connect-the-dot fashon. Identify the graph that matches each of the following stories: I had just left home when I realized I had forgotten my books so I went back to pick them up. How much rain fell in Mar of 1989?