
ZK Live Demo - Grid. Interactive Graphics for Data Analysis ––––––––– Principles and Examples. Data Mining Course. Wallpapering Fog: Losing touch... or why Excel and VBA won't cut it any more. Thinking through this post is making me feel old.

There's going to be a lot of 'in my day' type reminiscing and I'm only 34. It's all this new fangled technology that's doing it. The world's changing fast. I hate people who say that the world's changing fast, but this time it's true. I got my first proper job twelve years ago this month, as a junior analyst with a small econometrics consultancy and although the statistical techniques I use are roughly the same as back then, I've started to realise that our software tools are going through a revolution. Fairly quickly after starting that first job, I discovered that data processing in Excel was a hell of a lot faster and easier if you learned Visual Basic for Applications (VBA), so I did. Up until fairly recently, if an aspiring analyst asked what they should do to get ahead at work, I'd say get good in Excel. The trouble is, VBA's getting left behind. Fast Analytics and Rapid-fire Business Intelligence from Tableau Software.
The R Project for Statistical Computing. How to read an excel file (dot xls and dot xlsx) into a data frame with r. RStudio. R twotorials: how to build a for loop in r. Beginner to advanced resources for the R programming language. R Programming - Wikibooks, collection of open-content textbooks. Welcome to the R programming Wikibook This book is designed to be a practical guide to the R programming language[1].
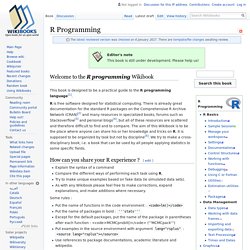
R is free software designed for statistical computing. There is already great documentation for the standard R packages on the Comprehensive R Archive Network (CRAN)[2] and many resources in specialized books, forums such as Stackoverflow[3] and personal blogs[4], but all of these resources are scattered and therefore difficult to find and to compare. The aim of this Wikibook is to be the place where anyone can share his or her knowledge and tricks on R. It is supposed to be organized by task but not by discipline[5]. How can you share your R experience ? Explain the syntax of a commandCompare the different ways of performing each task using R.Try to make unique examples based on fake data (ie simulated data sets).As with any Wikibook please feel free to make corrections, expand explanations, and make additions where necessary. Some rules : Prerequisites[edit] See also[edit] An online tool to convert UK post codes into longitude and latitude mapping coordinates. GPS Visualizer map input form: Plot quantitative data.
This is a special version of the GPS Visualizer map form that's designed for plotting quantifiable data on a map.
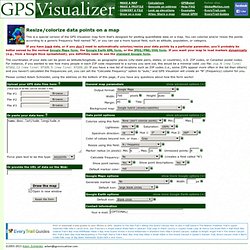
You can colorize and/or resize the points according to a generic frequency field named "N", or you can use a more typical field, such as altitude, population, or category. If you have track data, or if you don't need to automatically colorize/resize your data points by a particular parameter, you'll probably be better served by the normal Google Maps form, the Google Earth KML form, or the JPEG/PNG/SVG form.
If you want your map to load markers dynamically (e.g., from a Google Docs spreadsheet), you definitely need to use the standard Google form. The coordinates of your data can be given as latitude/longitude, as geographic places (city-state pairs, states, or countries), U.S. ZIP codes, or Canadian postal codes. Please contact Adam Schneider, using the address on the bottom of this page, if you have any questions about how this form works! Smart Data Collective. The maps library for R is a powerful tool for creating maps of countries and regions of the world.
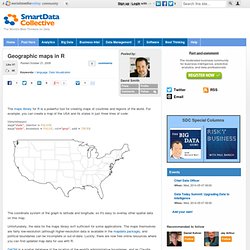
For example, you can create a map of the USA and its states in just three lines of code: library(maps) map("state", interior = FALSE) map("state", boundary = FALSE, col="gray", add = TRUE) The coordinate system of the graph is latitude and longitude, so it's easy to overlay other spatial data on this map. Unfortunately, the data for the maps library isn't sufficient for some applications. GADM is a spatial database of the location of the world's administrative boundaries, and as Claudia Engel discovered the map information is available as native R objects that can be plotted directly with the spplot function (from the sp package).
Library(sp)con <- url(" Sweet! AnthroSpace: Download Global Administrative Areas as RData files. Think Stats: Probability and Statistics for Programmers. R Programming. R. HTML5 Mobile Mapping. Simple Storage Service (Amazon S3) MongoDB.