
Pairwise sequence alignment with R. 2.3 years ago by New Zealand Hi Laksmi, It's not quite clear from your questoin, but do you want to do a pairwise alignment of each of your 90 sequences against a particular sequence (ie seq2[[1]] v seq1 then seq2[[2]] v seq1 in your example) or you want to do all the possible pairwsie comparisons between your 90 sequences.
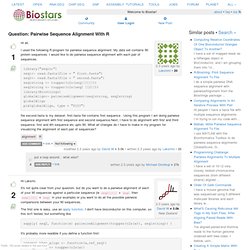
The first one is easy, use an apply function. I don't have bioconductor on this computer, so this isn't tested, but something like sapply( seq2, function(x) pairwiseAlignment(toupper(c2s(x)), seq1string)) ) It's probably more readible if you define a function first: Plot - R: multiple x axis with annotations. Plot - Control the size of points in an R scatterplot. Fitting polynomial model to data in R. Trellis Graphs.
The lattice package, written by Deepayan Sarkar, attempts to improve on base R graphics by providing better defaults and the ability to easily display multivariate relationships.

In particular, the package supports the creation of trellis graphs - graphs that display a variable or the relationship between variables, conditioned on one or more other variables. The typical format is graph_type(formula, data=) where graph_type is selected from the listed below. formula specifies the variable(s) to display and any conditioning variables . For example ~x|A means display numeric variable x for each level of factor A. y~x | A*B means display the relationship between numeric variables y and x separately for every combination of factor A and B levels.
Here are some examples. . # Lattice Examples library(lattice) attach(mtcars) # kernel density plot densityplot(~mpg, main="Density Plot", xlab="Miles per Gallon") # scatterplot matrix splom(mtcars[c(1,3,4,5,6)], main="MTCARS Data") click to view. G:Profiler - functional profiling of gene lists from large-scale experiments. Plus: a resource for protein phosphorylation and other post-translational modifications. Worm Interactome Version 8.
Bowtie: Tutorial. Download and extract the appropriate Bowtie binary release into a fresh directory.
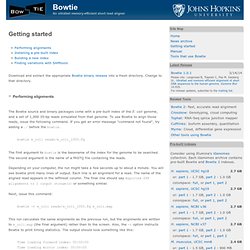
Change to that directory. Performing alignments The Bowtie source and binary packages come with a pre-built index of the E. coli genome, and a set of 1,000 35-bp reads simulated from that genome. To use Bowtie to align those reads, issue the following command. If you get an error message "command not found", try adding a ./ before the bowtie. bowtie e_coli reads/e_coli_1000.fq The first argument to bowtie is the basename of the index for the genome to be searched.
Depending on your computer, the run might take a few seconds up to about a minute. Next, issue this command: SciRoKo Downloads. SciRoKo is platform independent and runs in Windows, Linux and Mac OsX.
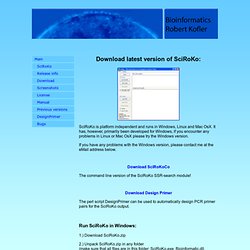
It has, however, primarily been developed for Windows, if you encounter any problems in Linux or Mac OsX please try the Windows version. If you have any problems with the Windows version, please contact me at the eMail address below. Download SciRoKoCo. Protein, Sequence, or Reference Search. Systems Browser. GeneFisher2 Submission page. Block Maker. CODEHOP. National Center for Biotechnology Information.
Genome Browser. The EMBL Nucleotide Sequence Database. European Bioinformatics Institute. BioMart. RCSB Protein Data Bank. SNP structure,function,disease: Genome browsers. DBGET. The Gene Ontology. ExPASy Proteomics Server. FastPHASE - Assets - Express Licenses - UW Center for Commercial. The program fastPHASE implements methods for estimating haplotypes and missing genotypes from population SNP genotype data.
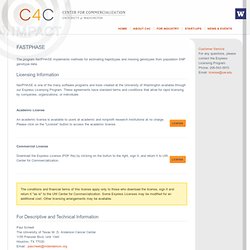
Licensing Information fastPHASE is one of the many software programs and tools created at the University of Washington available through our Express Licensing Program. These agreements have standard terms and conditions that allow for rapid licensing by companies, organizations, or individuals Academic License License An academic license is available to users at academic and nonprofit research institutions at no charge.
Commercial License License Download the Express License (PDF file) by clicking on the button to the right, sign it, and return it to UW Center for Commercialization. The conditions and financial terms of this license apply only to those who download the license, sign it and return it "as is" to the UW Center for Commercialization. For Descriptive and Technical Information Paul Scheet The University of Texas M. Email: pascheet@mdanderson.org. Haploview. Overview Haploview is designed to simplify and expedite the process of haplotype analysis by providing a common interface to several tasks relating to such analyses.
Haploview currently supports the following functionalities: LD & haplotype block analysis haplotype population frequency estimation single SNP and haplotype association tests permutation testing for association significance implementation of Paul de Bakker's Tagger tag SNP selection algorithm. Automatic download of phased genotype data from HapMap visualization and plotting of PLINK whole genome association results including advanced filtering options Haploview is fully compatible with data dumps from the HapMap project and the Perlegen Genotype Browser. The best way to become familiar with Haploview is to get the software and go through the tutorial. PLINK: Whole genome data analysis toolset. BEAGLE genetic association analysis software. Pfam: Search Pfam. Artemis: DNA Sequence Viewer and Annotation Tool - Wellcome Trus.