
Map² - The Zoomable Map on Paper: New York by Anne Stauche. UPDATE: 196 comments, 73 suggestions for new cities, 3 new rewards, 1 stretch goal...
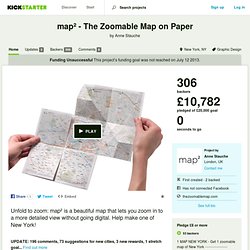
Find out more Even if your city is not available yet, please back the project. If 25% of the viewers of this project donated $10, the project would be fully funded. Today! WIRED - "Ingenious Zoomable Paper Map" CORE77 - "Fantastic design for a low-tech, zoomable paper map - Map², "The zoomable map on paper", uses nothing but folding and carefully-considered printing to achieve its killer app. " FASTCOMPANY - "Who needs smartphone apps when you've got a lot of ingenuity and some paper? BOINGBOING - "Map² is a clever London streetmap: each of its quadrants unfolds to show a zoomed-in view of that region, then refolds again quickly and easily. " COOLTHINGS - "Map² Makes The Paper Map Zoomable - Map² is looking to cut into our over-reliance on electronic maps a little by adding at least one level of zoom to the classic paper map. ...With its zoomable mechanism, it's quite possibly the coolest map I've ever seen.
" Translucent Network. Pulso: España en 2012. Pulso Pulso: España en 2012 es un trabajo realizado por Actibva junto con Vostok Studio y programado por @ditman .
Nicholas Felton. Mgmt. design. Information Is Beautiful. The Happy Show. Infographics XXXXL on Behance.
Gautier Breuvart - Portfolio 2013 - About Me on Behance. Information graphics in context on Behance. Identity Infographic on Behance. Ethical Issues '13 on Behance. Annually, the Royal Mail produces a portfolio of commemorative stamps.
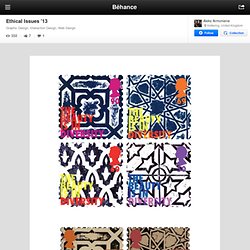
They select a number of key events, cultural themes or topics from histo… Read More Annually, the Royal Mail produces a portfolio of commemorative stamps. They select a number of key events, cultural themes or topics from history that are considered to be ‘significant’ and worthy of being celebrated by having a stamp edition designed in their honour. I had to choose an ethical issue for the project and create a set of Royal Mail stamps, which would reflect the ethical issue. I’ve decided to write about the discrimination of the Muslim in modern society – this topic appealed to me for its relevancy and the willingness to increase awareness. Deep green sea / work / Case study in Instagram. Deep green sea / welcome. The Art of Making, Alma Flamenca.
Transparency. Pattern Matters: Tangible Paper Infographic on Behance. GOOD Transparency Food: Waste Not, Want Not. The proof that we are soulmates. 24Moda "Travel Retail" - Il Sole 24 Ore on Behance. Colour and Space by Jotun on Behance. INFOGRAPHICS on Behance. Voice of Good Morning on Behance. People don’t recognize how important the starting of a day which affect their health and productivity.
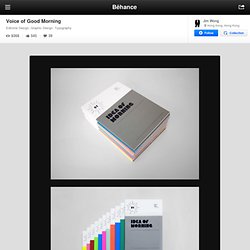
They feel exhausted and the situation k… Read More People don’t recognize how important the starting of a day which affect their health and productivity. They feel exhausted and the situation keep on everyday. A guide of “Good Morning” has designed for this. It provides the information of the brand assets,i.e. why having a good morning is important, the ways to achieve and maintain the consistence.
Infographics on Behance. Latino Influence Project Infographics on Behance. Agricultural infographics on Behance. Infographics / What Type of Social Media Personality Are You? Infographics / Scientists have only searched through a tiny fraction of our galaxy, and with the fast advances in technology, we can expect many more interesting discoveries in the future. But for now, check out the handy infographic below, courtesy of Sp. Data Visualization, Information Design and Infographics.
Infographics / Breaking Down Apple’s Billions. Infographics / Airbnb’s growth seems unstoppable. It booked 4 million nights of accommodation in users’ homes in 2011 — that’s four times the amount of business it had done in the previous four years. Infographics / Geeks vs Nerds! Infographics / You likely know that Facebook is the world’s largest social network with more than 800 million users, but did you know that more than 250 million photos are uploaded every single day? Or that the average American spends seven hours and 46 m. Infographics / Restaurant Chains on Social Media. Infographics / CYBERBULLYING: How bullies have moved from the playground to the web. Infographics / How to Use Google Search More Effectively. Infographics / Only 2% of People Can Multitask Successfully // Are you one of them? Infographics / Women on Wikipedia // Only 9% of Wikipedia Editors Are Women.
Infographics / A History of Western Typefaces. Infographics / Get Your Sleep! Infographic: How Do You Know if Antibiotics Are in Your Meat? The Rise of Entrepreneurship on College Campuses (Infographic) Skip Advertisement This ad will close in 15 seconds...
Young Entrepreneurs Today's Most Read 9 Proven Ways to Get People to Take You Seriously 4 Intangibles That Drive CEOs What It Takes to Go From Dead Broke to 6 Figures in 6 Months The Mentality of a Successful Career 4 Big Challenges That Startups Face These Siblings Are Cooking Up America's First Meatless Butcher Shop Kim Lachance Shandrow 3 min read News and Articles About Young Entrepreneurs Failure. Info graphic 3d Paper Resume on Behance. Infographics / The Most and Least Romantic States in America. Infographic: Over 400 Vegetables On One Incredibly Healthy Poster. When you’re a kid, vegetables are the worst.
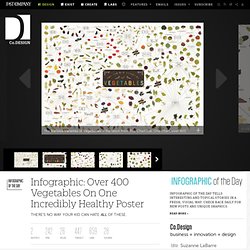
With time, however, their appeal presents itself. That has to do in part with maturing taste buds, and from a better understanding of the importance of healthy eating. But it also happens simply as you get acquainted with the sheer size of the vegetable kingdom. You not only have diverse families, from tomatoes to taproots to tubers, but also a staggering diversity within those groups. And even when you think you know your veggies, there are more to discover. Click to enlarge. The Various Varieties of Vegetables is the latest from Pop Chart Lab, featuring some 400 crops in all.
In their relentless quest to illustrate and classify the world around us, the folks at Pop Chart have mapped categories ranging from coffee and pie to guitars and video game controllers. Ben Gibson, the team’s creative director. But what, you ask, about vegetables’ similarly healthful counterpart? Infographic: How To Make Every Coffee Drink You Ever Wanted. The folks at PopChartLab have already tackled breweries, cocktails, and pies with their eye-pleasing infographics, each one meticulously researched and gorgeously rendered.
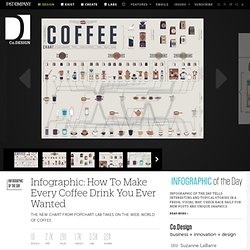
It’s a process[/url ] that undoubtedly involves a lot of coffee. Their newest work celebrates the whole family tree. Click to enlarge. The [url= Coffee Chart lays out the entire coffee ecosystem, outlining how various methods of production, including the French press, Kyoto dripper, and Neapolitan flip, among others, are used to create coffees, cortados, cappuccinos, and more. Coffee devotees can use the graphic as a way to announce their allegiance to the cocoa bean in all its manifestations.
Infographic Of The Day: Are U.S. Cities Like Detroit Really Dying? Flight to the suburbs, urban decay, ruin porn--we've all become yawningly familiar with these tropes of modern migration.
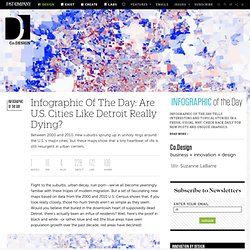
But a set of fascinating new maps based on data from the 2000 and 2010 U.S. Census shows that, if you look really closely, those ho-hum trends aren't as simple as they seem. Would you believe that buried in the downtown heart of supposedly dead Detroit, there's actually been an influx of residents? Well, here's the proof in black and white--or rather, blue and red (the blue areas have seen population growth over the past decade; red areas have declined): You practically need a microscope to notice, but as DataPointed points out, you can clearly see a "speckled blue island surrounded by a sea of red" right smack in the city center. Handmade Type on Vimeo - Nightly. Tien-Min Liao on Behance. The Work of Edward Tufte and Graphics Press. Edward Tufte is a statistician and artist, and Professor Emeritus of Political Science, Statistics, and Computer Science at Yale University.
He wrote, designed, and self-published 4 classic books on data visualization. The New York Times described ET as the "Leonardo da Vinci of data," and Business Week as the "Galileo of graphics. " He is now writing a book/film The Thinking Eye and constructing a 234-acre tree farm and sculpture park in northwest Connecticut, which will show his artworks and remain open space in perpetuity. He founded Graphics Press, ET Modern gallery/studio, and Hogpen Hill Farms LLC. Visual Display of Quantitative Information 200 pages. London Underground Map, Harry Beck, 1933 - Transport for London Art Posters. Diagram of the causes of mortality in the army in the East. *relajaelcoco. The Art of Making, The Carpenter. Hipster Vision. Cigarettes infographic. Roskilde Infographics. Motion Graphics - Design Services - Video Graphics Company.