
Economist Opinion Cloud by Infomous and Appinions. Überblick über die beliebtesten Visualisierungstools von R bis Z. Raphaël Softwaretyp: JavaScript-Bibliothek für Vektorgrafiken Lizenzmodell: Open Source unter MIT-Lizenz Anwender: Webdesigner und App-Entwickler mit Hardcoding-Kenntnissen Raphaël ist eine kleine JavaScript-Bibliothek, die speziell zur Erstellung von vektorbasierten Grafiken und Diagrammen für Web-Implementierungen entwickelt wurde.

Das Tool nutzt die Empfehlungen der W3C SVG-Working Group und Vektor Markup Language (VML) als Basis für Visualisierungsdesigns und ist deshalb durchaus anspruchsvoller als Point-and-Klick-Lösungen mit vergleichbarem Output. Softwaretyp: Big Data-Entwicklungsumgebung Lizenzmodell: Open Source Anwender: Professionelle Programmierer und Entwickler R ist eine Entwicklungsumgebung zur Umsetzung von statistischen Analysen, die zahlreiche Optionen zur Datenvisualisierung bereit hält und ideal für sehr große Datensätze geeignet ist. Revisit. Darwin Analytics. Common/images/site/features/2013/03/CascadingTreeSheets_338. 50 Great Examples of Data Visualization. Wrapping your brain around data online can be challenging, especially when dealing with huge volumes of information.

And trying to find related content can also be difficult, depending on what data you’re looking for. But data visualizations can make all of that much easier, allowing you to see the concepts that you’re learning about in a more interesting, and often more useful manner. Below are 50 of the best data visualizations and tools for creating your own visualizations out there, covering everything from Digg activity to network connectivity to what’s currently happening on Twitter. Music, Movies and Other Media Narratives 2.0 visualizes music. Liveplasma is a music and movie visualization app that aims to help you discover other musicians or movies you might enjoy.
Tuneglue is another music visualization service. MusicMap is similar to TuneGlue in its interface, but seems slightly more intuitive. Digg, Twitter, Delicious, and Flickr Internet Visualizations. Diagram Layout Software. Tom Sawyer Layout is a Software Development Kit (SDK) that provides nested drawing data models and layout, labeling, and routing technology for applications that have their own graphical framework.
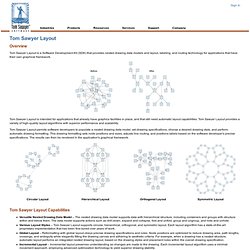
Tom Sawyer Layout is intended for applications that already have graphics facilities in place, and that still need automatic layout capabilities. Tom Sawyer Layout provides a variety of high-quality layout algorithms with superior performance and scalability. Tom Sawyer Layout permits software developers to populate a nested drawing data model, set drawing specifications, choose a desired drawing style, and perform automatic drawing formatting. This drawing formatting sets node positions and sizes, adjusts line routing, and positions labels based on the software developer's precise specifications. The results can then be rendered in the application's graphical framework. Tom Sawyer Layout is available in several editions to accommodate development with your specific technologies and platforms.
yFiles FLEX. Features. KeyLines is a flexible JavaScript toolkit for incorporating custom network visualization into your applications quickly, easily and in the most cost-effective way possible.
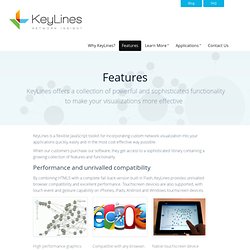
When our customers purchase our software, they get access to a sophisticated library containing a growing collection of features and functionality. Performance and unrivalled compatibility By combining HTML5 with a complete fall-back version built in Flash, KeyLines provides unrivalled browser compatibility and excellent performance. Touchscreen devices are also supported, with touch event and gesture capability on iPhones, iPads, Android and Windows touchscreen devices. High performance graphics supporting around 1000 chart elements Compatible with any browser, including most legacy versions Native touchscreen device support Design your own application KeyLines is a toolkit, not a pre-built application. Choose from our collection of icons or use your own. Screenshots. Visualizers. Graph Visualization and Neo4j. So far we’ve learned how to get Neo4j up and running with Neography, how to find friends of friends and degrees of separation with the Neo4j REST API and a little bit of the Gremlin and Cypher languages.
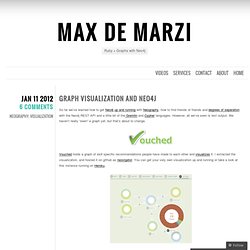
However, all we’ve seen is text output. We haven’t really “seen” a graph yet, but that’s about to change. Vouched holds a graph of skill specific recommendations people have made to each other and visualizes it. I extracted the visualization, and hosted it on github as neovigator. You can get your very own visualization up and running or take a look at this instance running on Heroku. Let’s get it up and running and then we’ll go through some pieces of the code. Then visit localhost:9292 to see it running. The website is a Sinatra Application with only two routes. The JSON object we create will have this structure:
@mesirii's viz board. The Graph Database - Graph Visualization. Linkurio.us Neo4j Graph Visualization Neo4j Partner Linkurious helps you make sense of your graph data through a simple web-based interface based on an open-source back-end that connects to your Neo4j Database.
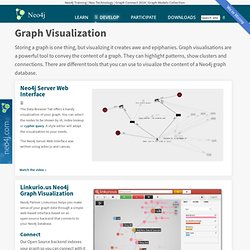
Connect Our Open Source backend indexes your graph so you can connect with it on Linkurious and get started in minutes. When it is done, launch the web application of Linkurious. Search Typing any keyword in the search bar brings up all the related data in one step. Explore. FutureNet. Mit dem FutureNet haben Sie die ganze Welt der Zukunftsforschung mit wenig Aufwand für Sie verfügbar und können die komplexen Zusammenhänge unterschiedlicher Zukünfte mit Ihrer Zukunftsstrategie abbilden.
Cytoscape: An Open Source Platform for Complex Network Analysis and Visualization. Visualization - architektur visualisierung emptyform/tjie darmstadt. A visual exploration on mapping complex networks.