
Aerial photos from Greenland topple climate models. How Climate Change Is Changing The Oyster Business : The Salt. Hide captionScientists blame higher levels of carbon dioxide in Pacific Ocean waters caused by global warming for the failure of oyster seeds to thrive in hatcheries.
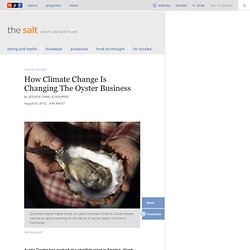
Eric Risberg/AP Scientists blame higher levels of carbon dioxide in Pacific Ocean waters caused by global warming for the failure of oyster seeds to thrive in hatcheries. Austin Docter has worked at a shellfish plant in Shelton, Wash., for 18 years and has a lot of words to describe what he calls the flavor profiles of oysters: Minerally. Metallic-y. Sweet. "Wherever oysters are grown, they take on the characteristics of the algae and water that they grow up in," Docter says. Greenland Ice Melt, Measured By NASA Satellites, Reaches Unprecedented Level. Unprecedented melting of Greenland's ice sheet this month has stunned NASA scientists and has highlighted broader concerns that the region is losing a remarkable amount of ice overall.
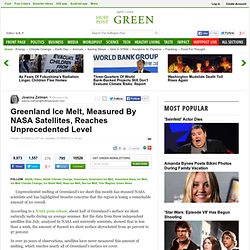
According to a NASA press release, about half of Greenland's surface ice sheet naturally melts during an average summer. But the data from three independent satellites this July, analyzed by NASA and university scientists, showed that in less than a week, the amount of thawed ice sheet surface skyrocketed from 40 percent to 97 percent. In over 30 years of observations, satellites have never measured this amount of melting, which reaches nearly all of Greenland's surface ice cover.
When Son Nghiem of NASA's Jet Propulsion Laboratory observed the recent melting phenomenon, he said in the NASA press release, "This was so extraordinary that at first I questioned the result: Was this real or was it due to a data error? " "One of the big questions is 'What's happening in the Arctic in general? '" Global Warming's Terrifying New Math. Study casts doubt on popular mass extinction theory. Mussels and other species of sea animals died in large numbers at the end of the Triassic geological period.
Scientists are trying to understand why. (Photo: Colourbox) About the time, 201 million years ago, that the super-continent Pangaea – the single land mass made up of all the present continents – started to break up, life on Earth was hit by a severe crisis that killed off numerous animal species. On land, the devastation was not so bad, although many plants did wither and die. Rise in sea level can't be stopped: scientists. By Nina Chestney LONDON Sun Jul 1, 2012 10:32pm IST LONDON (Reuters) - Rising sea levels cannot be stopped over the next several hundred years, even if deep emissions cuts lower global average temperatures, but they can be slowed down, climate scientists said in a study on Sunday.

A lot of climate research shows that rising greenhouse gas emissions are responsible for increasing global average surface temperatures by about 0.17 degrees Celsius a decade from 1980-2010 and for a sea level rise of about 2.3mm a year from 2005-2010 as ice caps and glaciers melt. Rising sea levels threaten about a tenth of the world's population who live in low-lying areas and islands which are at risk of flooding, including the Caribbean, Maldives and Asia-Pacific island groups. This is because as warmer temperatures penetrate deep into the sea, the water warms and expands as the heat mixes through different ocean regions. 'Hot Spring': Record Temps Herald Era of Warmer World.
Search Results. Journal home : Nature Climate Change. Climate change makes cod grow. Global warming doesn’t only have negative effects.

Clouds’ Effect on Climate Change Is Last Bastion for Dissenters. Over time, nearly every one of their arguments has been knocked down by accumulating evidence, and polls say 97 percent of working climate scientists now see global warming as a serious risk.
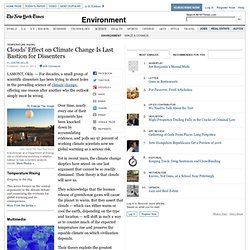
Yet in recent years, the climate change skeptics have seized on one last argument that cannot be so readily dismissed. Their theory is that clouds will save us. They acknowledge that the human release of greenhouse gases will cause the planet to warm. Arctic Sea Emits Methane. Computer model predicts tomorrow’s nature. Computers’ powers of calculation have developed considerably in recent years – a situation that researchers have used to create complex simulation models of nature.

The new Danish model is a sort of virtual experiment that is based on reality. Therefore the models offer new possibilities of understanding and predicting changes in the future. (Photo: Colourbox) How will nature be affected if we change agricultural subsidies, use other pesticides or build a motorway? So far, researchers have not had usable tools or information for answering such questions without time-consuming and expensive fieldwork. It's Getting Hot in Here: Understanding the Impact of the "Meteorological March Madness" It's going to take some time for science to catch up with what happened this past winter. For instance, a lot has been made of the "Meteorological March Madness" we just experienced, in which over 15,000 local, all-time warm-weather temperature records were broken across the U.S.
What is particularly significant, and alarming, is the broad context of this weather pattern, which is visualized in this animated video below, courtesy of NOAA’s Environmental Visualization Lab. NOAA: More Than 15,000 Temperature Records Broken In March. Should we blame the Sun? (Photo: NASA)

Force of Nature: Watch This Texas Tornado Toss Semi-Trucks Around (Video) Arctic Sea Ice Eyed for Clues to Weather Extremes. On the Brink: Planet Near Irreversible Point of Global Warming. We may have already passed the tipping points on global warming, say scientists at the Planet Under Pressure conference.

At the London conference, scientists are giving a bleak view of the future of the planet due to catastrophic damage and growth by humans, saying we are close to the irreversible point of global warming. Will Steffen, executive director of the Australian National University's climate change institute, gave an urgent warning that humanity needs to act radically on climate change.
"We can ... cap temperature rise at two degrees, or cross the threshold beyond which the system shifts to a much hotter state," he said. Gulf Oil Spill: Coral Death 'Definitively' Linked To BP Spill. NEW ORLEANS (AP) — After months of laboratory work, scientists say they can definitively finger oil from BP's blown-out well as the culprit for the slow death of a once brightly colored deep-sea coral community in the Gulf of Mexico that is now brown and dull.

In a study published Monday, scientists say meticulous chemical analysis of samples taken in late 2010 proves that oil from BP PLC's out-of-control Macondo well devastated corals living about 7 miles southwest of the well. The coral community is located over an area roughly the size of half a football field nearly a mile below the Gulf's surface. The damaged corals were discovered in October 2010 by academic and government scientists, but it's taken until now for them to declare a definite link to the oil spill. San Francisco Fights Erosion as Coastal Cities Watch Closely. Unprecedented, "Eye-Popping" Temperatures Soar, Highs Continue.
People from the Midwest and Northeast have been stepping out to record-setting temperatures this month.

Meteorologists are calling the temperatures unprecedented. Deke Arndt, who leads the climate monitoring branch of the National Climatic Data Center in Asheville, N.C., said, “This will be a March event that we’ll look back on as one of the big March events of modern history.” And Jonathan Martin, chairman of atmospheric and oceanic sciences at UW-Madison, adds, "This is to me the most unusual weather event I've witnessed in my lifetime. " Weather maps show many areas with temperatures at 30 degrees above normal days in a row. Compare today's "average" high temperatures to the forecast highs.Is this May or March? Andrew Freedman: Climate CentralHistoric March Heat Wave Sets New Milestones The March heat wave continues to shatter longstanding records from the Upper Midwest to the Northeast, with more than 2,200 warm temperature records set during the month so far. CO2 is confusing fish. A team of researchers has discovered how fish respond to increased levels of CO2 in sea waters.
(Photo: Göran Nilsson) Atmospheric CO2 levels are projected to rise in the coming years, and as atmospheric CO2 generally equilibrates with surface waters, a corresponding rise will be experienced by many life forms in the oceans. Alarmingly, the CO2 concentrations we could see as early as the end of this century affect fishes’ ability to hear, smell, orient and evade predators. Climate towers in the Faroes? CO2 map provides quality control for climate research.
The quest for the lost climate. Marine geologist Katrine Husum. Rising Sea Levels a Growing Risk to Coastal U.S., Study Says. Kiribati: First Nation to be Swallowed Up by the Sea. Antarctica Visitors Unwittingly Bring Invasive Species. The far reaches of Antarctica are no longer visited only by scientists and their support staff. Adventure tourists and curiosity seekers from Europe, North America and beyond now come by the boatful — and they're bringing some souvenirs from home. Ecologist Steven Chown tells Robert Siegel that visitors unknowingly carry seeds on their clothes and bags. Highway 12, Outer Banks Lifeline, Is Under Siege by Nature. INSURANCE INDUSTRY: Trust Us, Global Warming Is Real. Oceans' Acidity at Highest Point in 300 Million Years. ‘Expect the unprecedented’ Less Sea Ice Brings More Snow.