
Cartographie - Dérives. vMap - Veremes. Présentation vMap est une puissante application de webmapping reposant sur les technologies libres les plus modernes (OpenLayers 3, Google-Closure, AngularJS, Bootstrap…).
L’objectif de vMap n’est pas de publier directement des jeux de données géographiques (shp, postgis…), mais plutôt d’exploiter des flux produits par des serveurs cartographiques tels que OpenStreetMap, WMS ou Bing maps. vMap peut être utilisé de manière autonome pour consulter des flux publics. Pour gérer vos propres objets métier, il est nécessaire de lui adjoindre un serveur cartographique de type WMS tel que MapServer, GeoServer, ArcGis Server ou Veremap. L’architecture est composée de deux parties : vMap côté client et SAV (Serveur d’Application Vitis) côté serveur. Un environnement ouvert et professionnel Veremes fournit l’ensemble des services indispensables à l’exploitation de vMap dans un cadre professionnel : installation, support technique, formation, développement, personnalisation, intégration des données… This Online Tool Generates High-Quality Geographic Maps of Data in Seconds.
Tutorials. How to Make a State Grid Map in R Something of a cross between a reference table and a map, the state grid provides equal space to each state and a semblance of the country to quickly pick out individual states.
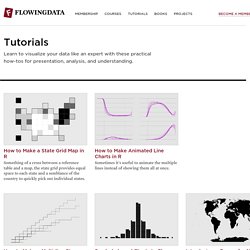
How to Make Animated Line Charts in R Sometimes it's useful to animate the multiple lines instead of showing them all at once. How to Make a Multi-line Step Chart in R For the times your data represents immediate changes in value. Symbols-based Charts to Show Counts in R Add visual weight by using individual items to show counts. Introducing a Course for Mapping in R Mapping geographic data in R can be tricky, because there are so many ways to complete separate tasks.
How to Edit R Charts in Adobe Illustrator A detailed guide for R users who want to polish their charts in the popular graphic design app for readability and aesthetics. How to Make an Animated Map in R, Part 4 In the the last part of the four-part series, you make a longer animation with more data and annotate. Introducing a Course for Mapping in R. Collaboration, Computer Vision, and Data—Challenges for Building Maps and Automotive AI. The main challenges for the mapping and automotive industries are people applying methods that don’t scale, and people holding on to their data in a prisoner’s dilemma like manner.
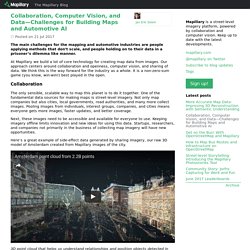
At Mapillary we build a lot of core technology for creating map data from images. Our approach centers around collaboration and openness, computer vision, and sharing of data. We think this is the way forward for the industry as a whole. It is a non-zero-sum game (you know, win-win!) Best played in the open. Collaboration The only sensible, scalable way to map this planet is to do it together. Next, these images need to be accessible and available for everyone to use. Here’s a great example of side-effect data generated by sharing imagery, our raw 3D model of Amsterdam created from Mapillary images of the city. 3D point cloud that helps us understand relationships and position objects detected in images Computer vision Some examples of automatic detections using computer vision. MapXtract. MapR Converge Community. Converged Data Platform. « Ceux qui ne sont jamais arrivés », une image du naufrage migratoire en Méditerranée - Levi Westerveld - Visionscarto.
Data literacy, media innovation and civic art. Plateforme de visualisation de données ouvertes. Plateforme de visualisation de données ouvertes. Une cartographie en temps réel des satellites et de leur périple. Les humains ont la capacité d’envoyer des objets dans l’espace depuis le milieu du 20ème siècle. Le célèbre satellite russe Spoutnik fut le premier d’une longue lignée et fut suivi par de nombreux petits frères américains et internationaux. On compte aujourd’hui plus de 2000 de ces objets orbitaux tournant silencieusement autour de notre planète.
Ces satellites qui prolifèrent nous observent non seulement de là-haut mais ils jouent également un rôle très important dans nos vies. Ils sont, entre autre, utilisés dans des domaines aussi variés que les télécommunications, la météorologie, la navigation, la gestion des ressources, le suivi des risques naturels. Ces missions essentielles ne les rendent pourtant pas moins discrets et mystérieux. Un extrait de Line of Sight et de ses trajectoires de satellites centré sur la France: Cette carte en temps réel a été créée par Patricio Gonzalez, artiste new yorkais et cartographe chez Mapzen. Comment cela fonctionne-t-il : Windytv / Windyty, wind map & forecast.
Maps Archives.